Huron Consulting Group Inc. (HURN): Price and Financial Metrics
GET POWR RATINGS... FREE!
HURN POWR Grades
- Growth is the dimension where HURN ranks best; there it ranks ahead of 97.15% of US stocks.
- HURN's strongest trending metric is Growth; it's been moving up over the last 179 days.
- HURN's current lowest rank is in the Momentum metric (where it is better than 38.1% of US stocks).
HURN Stock Summary
- The price/operating cash flow metric for Huron Consulting Group Inc is higher than 90.89% of stocks in our set with a positive cash flow.
- Over the past twelve months, HURN has reported earnings growth of -456.98%, putting it ahead of merely 4.54% of US stocks in our set.
- In terms of volatility of its share price, HURN is more volatile than only 11.41% of stocks we're observing.
- Stocks that are quantitatively similar to HURN, based on their financial statements, market capitalization, and price volatility, are NMRK, CIDM, NCSM, LOB, and AUVI.
- Visit HURN's SEC page to see the company's official filings. To visit the company's web site, go to www.huronconsultinggroup.com.
HURN Valuation Summary
- In comparison to the median Industrials stock, HURN's price/sales ratio is 23.53% lower, now standing at 1.3.
- Over the past 205 months, HURN's price/sales ratio has gone down 0.8.
Below are key valuation metrics over time for HURN.
Stock | Date | P/S | P/B | P/E | EV/EBIT |
---|---|---|---|---|---|
HURN | 2021-08-26 | 1.3 | 2.0 | 47.6 | 42.4 |
HURN | 2021-08-25 | 1.3 | 2.1 | 48.6 | 43.1 |
HURN | 2021-08-24 | 1.3 | 2.1 | 49.0 | 43.4 |
HURN | 2021-08-23 | 1.3 | 2.1 | 47.9 | 42.6 |
HURN | 2021-08-20 | 1.3 | 2.1 | 48.4 | 43.0 |
HURN | 2021-08-19 | 1.3 | 2.1 | 48.0 | 42.7 |
HURN Growth Metrics
- Its year over year cash and equivalents growth rate is now at -85.68%.
- The 5 year net income to common stockholders growth rate now stands at -106.09%.
- Its 2 year net cashflow from operations growth rate is now at 39.6%.

The table below shows HURN's growth in key financial areas (numbers in millions of US dollars).
Date | Revenue | Operating Cash Flow | Net Income to Common Stock |
---|---|---|---|
2021-12-31 | 926.958 | 17.987 | 62.987 |
2021-09-30 | 866.323 | 30.547 | 25.792 |
2021-06-30 | 846.79 | 72.963 | 23.123 |
2021-03-31 | 834.239 | 110.13 | 23.873 |
2020-12-31 | 871.014 | 136.738 | -23.84 |
2020-09-30 | 926.112 | 158.46 | -3.39 |
HURN's Quality Factors
The “Quality” component of the POWR Ratings focuses on 31 different factors of a companies fundamentals and operational strength. Here are some key insights as we drill into the specifics of these quality attributes.- HURN has a Quality Grade of C, ranking ahead of 42.99% of graded US stocks.
- HURN's asset turnover comes in at 0.827 -- ranking 176th of 563 Business Services stocks.
- SYNH, MARA, and TAOP are the stocks whose asset turnover ratios are most correlated with HURN.
The table below shows HURN's key quality metrics over time.
Period | Asset Turnover | Gross Margin | ROIC |
---|---|---|---|
2021-09-30 | 0.827 | 0.284 | 0.063 |
2021-06-30 | 0.801 | 0.279 | 0.060 |
2021-03-31 | 0.776 | 0.282 | 0.061 |
2020-12-31 | 0.781 | 0.283 | -0.039 |
2020-09-30 | 0.821 | 0.289 | 0.007 |
2020-06-30 | 0.839 | 0.296 | 0.015 |
HURN Price Target
For more insight on analysts targets of HURN, see our HURN price target page. And for a list of of all stocks sorted by upside potential based on analyst target price, see our Top Price Target page.
Average Price Target | $70.00 | Average Broker Recommendation | 1.2 (Strong Buy) |
HURN Stock Price Chart Interactive Chart >
HURN Price/Volume Stats
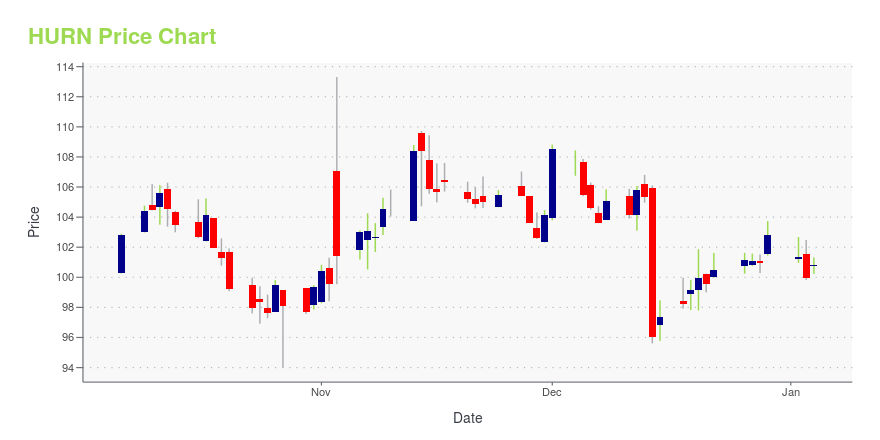
Current price | $57.00 | 52-week high | $60.54 |
Prev. close | $57.71 | 52-week low | $42.66 |
Day low | $56.47 | Volume | 96,600 |
Day high | $57.94 | Avg. volume | 133,693 |
50-day MA | $51.13 | Dividend yield | N/A |
200-day MA | $49.31 | Market Cap | 1.21B |
Huron Consulting Group Inc. (HURN) Company Bio
Huron Consulting Group helps clients in diverse industries improve performance, transform the enterprise, reduce costs, leverage technology, process and review large amounts of complex data, address regulatory changes, recover from distress and stimulate growth. The company was founded in 2002 and is based in Chicago, Illinois.
Latest HURN News From Around the Web
Below are the latest news stories about Huron Consulting Group Inc that investors may wish to consider to help them evaluate HURN as an investment opportunity.
Huron Consulting (HURN) Surpasses Q4 Earnings and Revenue EstimatesHuron Consulting (HURN) delivered earnings and revenue surprises of 3.90% and 5.65%, respectively, for the quarter ended December 2021. Do the numbers hold clues to what lies ahead for the stock? |
Huron Announces Fourth Quarter and Full Year 2021 Financial Results, and Provides 2022 GuidanceCHICAGO, February 24, 2022--Global professional services firm Huron (NASDAQ: HURN) today announced financial results from continuing operations for the fourth quarter ended December 31, 2021. |
Huron Consulting (HURN) Earnings Expected to Grow: Should You Buy?Huron Consulting (HURN) doesn't possess the right combination of the two key ingredients for a likely earnings beat in its upcoming report. Get prepared with the key expectations. |
Huron Announces Dates for Fourth Quarter and Full Year 2021 Earnings Release and Webcast and Virtual Investor DayCHICAGO, February 10, 2022--Global professional services firm Huron (NASDAQ: HURN) will announce its financial results for the fourth quarter and full year ended Dec. 31, 2021, after the market closes on Thursday, Feb. 24, 2022. The Company will also host a virtual Investor Day on Tuesday, Mar. 29, 2022. |
Huron Named ‘Best Place to Work For LGBTQ Equality’CHICAGO, January 27, 2022--Global professional services firm Huron (NASDAQ: HURN) today announced that it has been recognized as a "Best Place to Work for LGBTQ Equality" by the Human Rights Campaign (HRC) Foundation. Huron scored a perfect 100 on the HRC Foundation’s 2022 Corporate Equality Index (CEI), which evaluates employers on corporate policies, equal employment opportunities and benefits. |
HURN Price Returns
1-mo | 4.22% |
3-mo | 22.08% |
6-mo | 11.50% |
1-year | 4.41% |
3-year | 18.77% |
5-year | 38.35% |
YTD | 14.23% |
2021 | -15.35% |
2020 | -14.22% |
2019 | 33.93% |
2018 | 26.85% |
2017 | -20.14% |
Continue Researching HURN
Here are a few links from around the web to help you further your research on Huron Consulting Group Inc's stock as an investment opportunity:Huron Consulting Group Inc (HURN) Stock Price | Nasdaq
Huron Consulting Group Inc (HURN) Stock Quote, History and News - Yahoo Finance
Huron Consulting Group Inc (HURN) Stock Price and Basic Information | MarketWatch
Loading social stream, please wait...