
Intercontinental Exchange Inc. (ICE): Price and Financial Metrics
ICE Price/Volume Stats
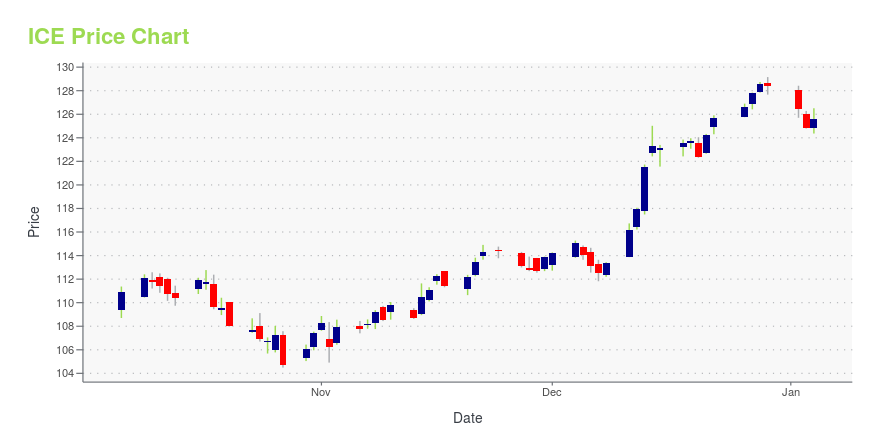
| Current price | $151.00 | 52-week high | $151.72 |
| Prev. close | $149.03 | 52-week low | $104.49 |
| Day low | $149.55 | Volume | 2,066,900 |
| Day high | $151.72 | Avg. volume | 2,416,380 |
| 50-day MA | $139.65 | Dividend yield | 1.21% |
| 200-day MA | $129.10 | Market Cap | 86.61B |
ICE Stock Price Chart Interactive Chart >
Intercontinental Exchange Inc. (ICE) Company Bio
The Intercontinental Exchange (ICE) is an American Fortune 500 company formed in 2000 that operates global exchanges, clearing houses and provides mortgage technology, data and listing services. The company owns exchanges for financial and commodity markets, and operates 12 regulated exchanges and marketplaces. This includes ICE futures exchanges in the United States, Canada and Europe, the Liffe futures exchanges in Europe, the New York Stock Exchange, equity options exchanges and OTC energy, credit and equity markets. (Source:Wikipedia)
Latest ICE News From Around the Web
Below are the latest news stories about INTERCONTINENTAL EXCHANGE INC that investors may wish to consider to help them evaluate ICE as an investment opportunity.
ICE solidifies position as the dominant player in the mortgage tech space in 2023The mortgage tech industry has taken its fair share of punches in 2023. But for ICE, it was a year of solidifying its dominance in the mortgage space. |
NYSE President Lynn Martin’s advice on leading through changeHandling change is one of the more difficult challenges that companies and especially leaders have to face. NYSE President Lynn Martin gives Yahoo Finance her advice for leading through change after guiding the historic exchange through the Covid-19 pandemic. Martin explains that “people tend to view change as scary. I think that's human nature.” Her advice is to communicate on multiple levels, “communicate with peers, communicate with your manager and communicate with the people that work for you because everyone craves communication during change.” Additionally, Martin says, “work hard. Keep executing your job. Don't fall, don't fall victim to water cooler talk, particularly around change… And then the third piece of advice I tend to give people is raise your hand if there's something... |
Keeping the New York Stock Exchange human in the digital ageFor 231 years, investors have been trading on what is now known as Wall Street. The iconic New York Stock Exchange has survived through the Civil War and the September 11th attacks. The person who navigated the exchange through the most recent challenge, the Covid-19 pandemic is NYSE President Lynn Martin. In the latest episode of Yahoo Finance's Lead This Way, she conveys how communication and empowering customers is at the core of her leadership style. Martin, who became the NYSE President in September of 2022 is the second woman to fill that role in the institution’s long history. Coming from a tech background, she says that she is a data driven person and relies on numbers to tell her story. Having led the NYSE through the challenges of the Covid-19 pandemic, she stresses that open ... |
ICE First Look at November Mortgage Performance: Delinquencies Historically Low Despite Seasonal Rise; Performance of Recent Originations Worth WatchingATLANTA & NEW YORK, December 21, 2023--Intercontinental Exchange, Inc. (NYSE:ICE), a leading global provider of data, technology, and market infrastructure, reports the following "first look" at November 2023 month-end mortgage performance statistics derived from its loan-level database representing the majority of the national mortgage market. |
ICE Reports Record Liquidity Across its Global Natural Gas Futures Markets with Record Open Interest in Henry Hub FuturesNEW YORK & LONDON & AMSTERDAM, December 20, 2023--Intercontinental Exchange, Inc. (NYSE:ICE), a leading global provider of data, technology, and market infrastructure, today announced record liquidity across its global natural gas futures markets, including record open interest in ICE’s Henry Hub natural gas futures market. |
ICE Price Returns
| 1-mo | 9.91% |
| 3-mo | 15.03% |
| 6-mo | 19.44% |
| 1-year | 33.21% |
| 3-year | 30.01% |
| 5-year | 80.02% |
| YTD | 18.35% |
| 2023 | 27.12% |
| 2022 | -23.91% |
| 2021 | 19.94% |
| 2020 | 26.15% |
| 2019 | 24.47% |
ICE Dividends
| Ex-Dividend Date | Type | Payout Amount | Change | ||||||
|---|---|---|---|---|---|---|---|---|---|
| Loading, please wait... | |||||||||
Continue Researching ICE
Want to do more research on Intercontinental Exchange Inc's stock and its price? Try the links below:Intercontinental Exchange Inc (ICE) Stock Price | Nasdaq
Intercontinental Exchange Inc (ICE) Stock Quote, History and News - Yahoo Finance
Intercontinental Exchange Inc (ICE) Stock Price and Basic Information | MarketWatch
Loading social stream, please wait...