
ICF International, Inc. (ICFI): Price and Financial Metrics
ICFI Price/Volume Stats
| Current price | $144.09 | 52-week high | $158.00 |
| Prev. close | $140.74 | 52-week low | $115.41 |
| Day low | $141.81 | Volume | 113,400 |
| Day high | $144.40 | Avg. volume | 102,521 |
| 50-day MA | $141.14 | Dividend yield | 0.39% |
| 200-day MA | $140.37 | Market Cap | 2.70B |
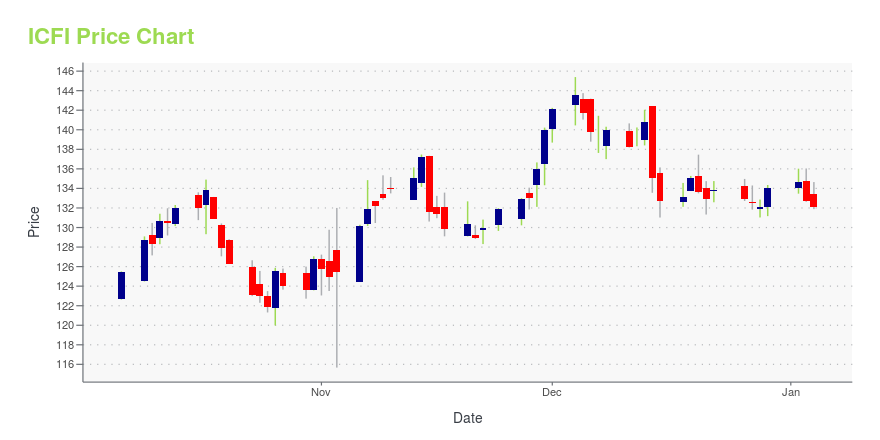
ICFI Stock Price Chart Interactive Chart >
ICF International, Inc. (ICFI) Company Bio
ICF International provides management, technology, and policy consulting and implementation services to government and commercial clients in the United States and internationally. The company was founded in 1969 and is based in Fairfax, Virginia.
Latest ICFI News From Around the Web
Below are the latest news stories about ICF INTERNATIONAL INC that investors may wish to consider to help them evaluate ICFI as an investment opportunity.
ICF International (ICFI) Rises 34.8% in a Year: Here's HowPast and future acquisitions are expected to contribute to the growth of ICF International's (ICFI) EBITDA and free cash flow. |
Why Is Maximus (MMS) Up 1% Since Last Earnings Report?Maximus (MMS) reported earnings 30 days ago. What's next for the stock? We take a look at earnings estimates for some clues. |
Why This 1 Business Services Stock Could Be a Great Addition to Your PortfolioWondering how to pick strong, market-beating stocks for your investment portfolio? Look no further than the Zacks Focus List. |
U.S. Forest Service Selects ICF for New $78 Million Digital Modernization Task OrderICF (NASDAQ:ICFI), a global consulting and technology services provider, was recently awarded a new $78 million task order by the U.S. Department of Agriculture's (USDA) U.S. Forest Service (USFS) to modernize wildfire management applications and services. The task order, which was awarded under ICF's General Services Administration's (GSA) IT Schedule with ICF as the team lead in conjunction with Xentity Corp through a GSA contractor teaming agreement in the third quarter of 2023, has a term of |
ICF to Present at the Sidoti Small Cap ConferenceICF (NASDAQ:ICFI), a global consulting and technology services provider, today announced its participation at the Sidoti Small Cap Conference. ICF Chief Operating Officer James Morgan will host a virtual fireside chat at 11:30 a.m. Eastern Time on Wednesday, December 6. |
ICFI Price Returns
| 1-mo | -3.94% |
| 3-mo | 1.65% |
| 6-mo | 1.84% |
| 1-year | 24.17% |
| 3-year | 63.37% |
| 5-year | 74.85% |
| YTD | 7.66% |
| 2023 | 35.99% |
| 2022 | -2.87% |
| 2021 | 38.79% |
| 2020 | -18.20% |
| 2019 | 42.44% |
ICFI Dividends
| Ex-Dividend Date | Type | Payout Amount | Change | ||||||
|---|---|---|---|---|---|---|---|---|---|
| Loading, please wait... | |||||||||
Continue Researching ICFI
Want to do more research on ICF International Inc's stock and its price? Try the links below:ICF International Inc (ICFI) Stock Price | Nasdaq
ICF International Inc (ICFI) Stock Quote, History and News - Yahoo Finance
ICF International Inc (ICFI) Stock Price and Basic Information | MarketWatch
Loading social stream, please wait...