IES Holdings, Inc. (IESC): Price and Financial Metrics

IES Holdings, Inc. (IESC): $121.00

4.88 (+4.20%)

POWR Rating

Component Grades

Momentum

B

Stability

B

Sentiment

Quality

B

Add IESC to Watchlist
Sign Up

Industry: Industrial - Services

Industry

A

Ranked

#1 of 77

in industry

IESC Price/Volume Stats

Current price $121.00 52-week high $122.83
Prev. close $116.12 52-week low $40.00
Day low $115.76 Volume 130,012
Day high $122.83 Avg. volume 86,386
50-day MA $99.70 Dividend yield N/A
200-day MA $75.24 Market Cap 2.45B

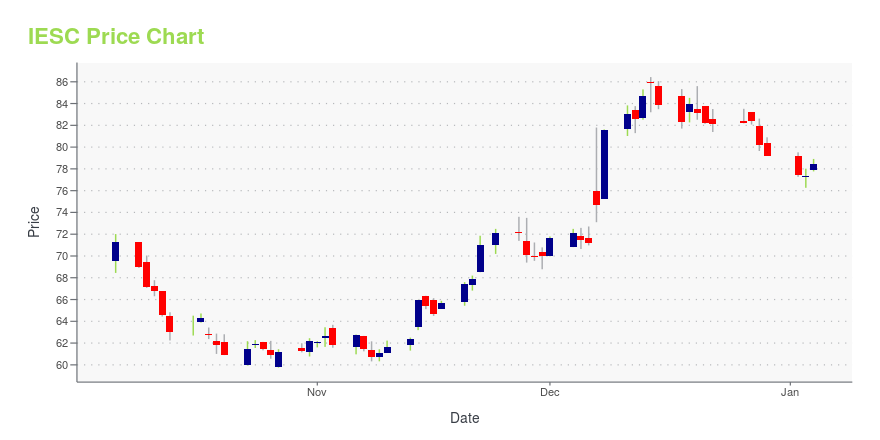
IESC Stock Price Chart Interactive Chart >

IESC POWR Grades

  • Quality is the dimension where IESC ranks best; there it ranks ahead of 93.89% of US stocks.
  • IESC's strongest trending metric is Quality; it's been moving up over the last 26 weeks.
  • IESC's current lowest rank is in the Sentiment metric (where it is better than 74.38% of US stocks).

IESC Stock Summary

  • Of note is the ratio of IES HOLDINGS INC's sales and general administrative expense to its total operating expenses; 98.71% of US stocks have a lower such ratio.
  • With a year-over-year growth in debt of -64.85%, IES HOLDINGS INC's debt growth rate surpasses merely 3.08% of about US stocks.
  • In terms of twelve month growth in earnings before interest and taxes, IES HOLDINGS INC is reporting a growth rate of 196.89%; that's higher than 93.94% of US stocks.
  • If you're looking for stocks that are quantitatively similar to IES HOLDINGS INC, a group of peers worth examining would be FIX, IPW, JBSS, APOG, and TWIN.
  • IESC's SEC filings can be seen here. And to visit IES HOLDINGS INC's official web site, go to www.ies-co.com.

IESC Valuation Summary

  • IESC's price/sales ratio is 0.7; this is 41.67% lower than that of the median Industrials stock.
  • Over the past 243 months, IESC's price/earnings ratio has gone down 2.8.

Below are key valuation metrics over time for IESC.

Stock Date P/S P/B P/E EV/EBIT
IESC 2023-12-29 0.7 4.0 14.8 10.4
IESC 2023-12-28 0.7 4.0 15.0 10.6
IESC 2023-12-27 0.7 4.2 15.4 10.9
IESC 2023-12-26 0.7 4.2 15.3 10.8
IESC 2023-12-22 0.7 4.1 15.3 10.8
IESC 2023-12-21 0.7 4.1 15.3 10.8

IESC Growth Metrics

    The 3 year revenue growth rate now stands at 92.25%.
  • Its year over year revenue growth rate is now at 47.35%.
  • Its 4 year price growth rate is now at 21.05%.
IESC's revenue has moved up $1,117,613,000 over the prior 34 months.

The table below shows IESC's growth in key financial areas (numbers in millions of US dollars).

Date Revenue Operating Cash Flow Net Income to Common Stock
2022-12-31 2,261.173 55.069 46.7
2022-09-30 2,166.808 16.262 34.762
2022-06-30 2,033.226 -15.024 40.94
2022-03-31 1,871.796 -13.342 50.776
2021-12-31 1,702.164 -6.789 69.024
2021-09-30 1,536.493 37.924 66.658

IESC's Quality Factors

The “Quality” component of the POWR Ratings focuses on 31 different factors of a companies fundamentals and operational strength. Here are some key insights as we drill into the specifics of these quality attributes.
  • IESC has a Quality Grade of B, ranking ahead of 81.18% of graded US stocks.
  • IESC's asset turnover comes in at 2.212 -- ranking 3rd of 51 Construction stocks.
  • AGX, FBHS, and TPC are the stocks whose asset turnover ratios are most correlated with IESC.

The table below shows IESC's key quality metrics over time.

Period Asset Turnover Gross Margin ROIC
2021-06-30 2.212 0.191 0.306
2021-03-31 2.199 0.197 0.304
2020-12-31 2.214 0.192 0.259
2020-09-30 2.288 0.191 0.244
2020-06-30 2.347 0.183 0.257
2020-03-31 2.433 0.174 0.241

IES Holdings, Inc. (IESC) Company Bio


IES Holdings, Inc. engages in communications, residential, commercial and industrial, and infrastructure solutions businesses primarily in the United States. The company was founded in 1997 and is based in Houston, Texas.


IESC Latest News Stream


Event/Time News Detail
Loading, please wait...

IESC Latest Social Stream


Loading social stream, please wait...

View Full IESC Social Stream

Latest IESC News From Around the Web

Below are the latest news stories about IES HOLDINGS INC that investors may wish to consider to help them evaluate IESC as an investment opportunity.

A Piece Of The Puzzle Missing From IES Holdings, Inc.'s (NASDAQ:IESC) 28% Share Price Climb

IES Holdings, Inc. ( NASDAQ:IESC ) shareholders have had their patience rewarded with a 28% share price jump in the...

Yahoo | December 18, 2023

Insider Sell Alert: Director Todd Cleveland Sells Shares of IES Holdings Inc (IESC)

Recent filings with the SEC have revealed that Todd Cleveland, a director of IES Holdings Inc (NASDAQ:IESC), has sold 10,150 shares of the company on December 11, 2023.

Yahoo | December 15, 2023

IES Holdings (NASDAQ:IESC) shareholder returns have been fantastic, earning 406% in 5 years

For many, the main point of investing in the stock market is to achieve spectacular returns. While not every stock...

Yahoo | December 10, 2023

IESC Stock Earnings: IES Hldgs Reported Results for Q4 2023

IES Hldgs just reported results for the fourth quarter of 2023.

InvestorPlace Earnings on InvestorPlace | December 7, 2023

IES Holdings Inc (IESC) Reports Strong Earnings Growth in Fiscal 2023

Net Income Soars by 212% and Revenue Climbs 10% for the Full Fiscal Year

Yahoo | December 7, 2023

Read More 'IESC' Stories Here

IESC Price Returns

1-mo 14.32%
3-mo 52.74%
6-mo 83.70%
1-year 180.42%
3-year 154.04%
5-year 580.92%
YTD 52.74%
2023 122.72%
2022 -29.76%
2021 9.99%
2020 79.42%
2019 65.02%

Continue Researching IESC

Want to see what other sources are saying about IES Holdings Inc's financials and stock price? Try the links below:

IES Holdings Inc (IESC) Stock Price | Nasdaq
IES Holdings Inc (IESC) Stock Quote, History and News - Yahoo Finance
IES Holdings Inc (IESC) Stock Price and Basic Information | MarketWatch

Get Free Updates

Join thousands of investors who get the latest news, insights and top rated picks from StockNews.com!