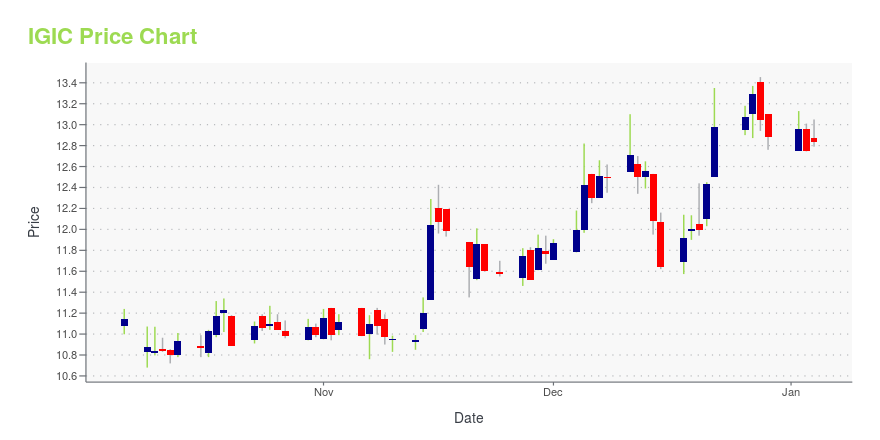
International General Insurance Holdings Ltd. (IGIC): Price and Financial Metrics
IGIC Price/Volume Stats
| Current price | $25.17 | 52-week high | $27.76 |
| Prev. close | $24.45 | 52-week low | $12.83 |
| Day low | $24.90 | Volume | 14,291 |
| Day high | $25.48 | Avg. volume | 104,745 |
| 50-day MA | $25.40 | Dividend yield | 0.4% |
| 200-day MA | $21.95 | Market Cap | 1.14B |
IGIC Stock Price Chart Interactive Chart >
International General Insurance Holdings Ltd. (IGIC) Company Bio
International General Insurance Holdings Ltd. provides specialty insurance and reinsurance solutions worldwide. The company operates through three segments: Specialty Long-tail, Specialty Short-tail, and Reinsurance segments. It offers a portfolio of specialty lines insurance products and services for energy, property, construction and engineering, ports and terminals, general aviation, political violence, casualty, financial institutions, and marine liability. The company was founded in 2001 and is based in Amman, Jordan.
IGIC Price Returns
| 1-mo | -3.14% |
| 3-mo | 8.25% |
| 6-mo | 23.56% |
| 1-year | 96.78% |
| 3-year | 247.47% |
| 5-year | 331.72% |
| YTD | 9.62% |
| 2024 | 92.38% |
| 2023 | 61.66% |
| 2022 | 1.62% |
| 2021 | 4.19% |
| 2020 | N/A |
IGIC Dividends
| Ex-Dividend Date | Type | Payout Amount | Change | ||||||
|---|---|---|---|---|---|---|---|---|---|
| Loading, please wait... | |||||||||


Loading social stream, please wait...