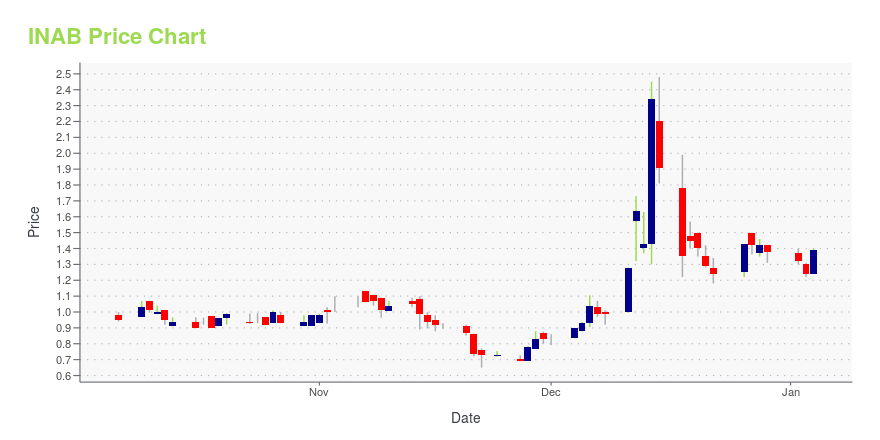
IN8bio, Inc. (INAB): Price and Financial Metrics
INAB Price/Volume Stats
| Current price | $0.30 | 52-week high | $1.74 |
| Prev. close | $0.30 | 52-week low | $0.22 |
| Day low | $0.27 | Volume | 408,400 |
| Day high | $0.31 | Avg. volume | 1,025,091 |
| 50-day MA | $0.31 | Dividend yield | N/A |
| 200-day MA | $0.63 | Market Cap | 21.47M |
INAB Stock Price Chart Interactive Chart >
IN8bio, Inc. (INAB) Company Bio
IN8bio, Inc., a clinical-stage biotechnology company, focuses on the discovery, development, and commercialization of gamma-delta T cell therapies for the treatment of cancers. The company develops INB-200, a genetically modified autologous gamma-delta T cell product candidate that is in Phase I clinical trial for the treatment of solid tumors; and INB-100, an allogeneic product candidate, which is in Phase I clinical trial to treat patients with acute leukemia undergoing hematopoietic stem cell transplantation. It also develops INB-400 and INB-300 that is in preclinical Phase for treatment of various solid tumor cancers. The company was formerly known as Incysus Therapeutics, Inc. and changed its name to IN8bio, Inc. in August 2020. IN8bio, Inc. was incorporated in 2016 and is headquartered in New York, New York.
INAB Price Returns
| 1-mo | 20.58% |
| 3-mo | -7.41% |
| 6-mo | -63.09% |
| 1-year | -77.44% |
| 3-year | -90.66% |
| 5-year | N/A |
| YTD | 16.64% |
| 2024 | -81.36% |
| 2023 | -40.26% |
| 2022 | -47.38% |
| 2021 | N/A |
| 2020 | N/A |


Loading social stream, please wait...