Summit Hotel Properties, Inc. (INN): Price and Financial Metrics
GET POWR RATINGS... FREE!
INN POWR Grades
- INN scores best on the Growth dimension, with a Growth rank ahead of 82.92% of US stocks.
- The strongest trend for INN is in Value, which has been heading up over the past 177 days.
- INN ranks lowest in Quality; there it ranks in the 11th percentile.
INN Stock Summary
- Of note is the ratio of SUMMIT HOTEL PROPERTIES INC's sales and general administrative expense to its total operating expenses; just 6.05% of US stocks have a lower such ratio.
- Over the past twelve months, INN has reported earnings growth of -209.51%, putting it ahead of just 7.57% of US stocks in our set.
- As for revenue growth, note that INN's revenue has grown 101.2% over the past 12 months; that beats the revenue growth of 91.84% of US companies in our set.
- If you're looking for stocks that are quantitatively similar to SUMMIT HOTEL PROPERTIES INC, a group of peers worth examining would be AKR, DAC, EDRY, CSR, and ESBA.
- INN's SEC filings can be seen here. And to visit SUMMIT HOTEL PROPERTIES INC's official web site, go to www.shpreit.com.
INN Valuation Summary
- INN's price/earnings ratio is -45; this is 285.19% lower than that of the median Real Estate stock.
- INN's price/earnings ratio has moved down 30.7 over the prior 146 months.
Below are key valuation metrics over time for INN.
Stock | Date | P/S | P/B | P/E | EV/EBIT |
---|---|---|---|---|---|
INN | 2023-02-01 | 1.5 | 0.9 | -45.0 | 39.5 |
INN | 2023-01-31 | 1.5 | 0.9 | -45.0 | 39.5 |
INN | 2023-01-30 | 1.4 | 0.9 | -43.1 | 38.8 |
INN | 2023-01-27 | 1.5 | 0.9 | -44.1 | 39.1 |
INN | 2023-01-26 | 1.5 | 0.9 | -43.8 | 39.0 |
INN | 2023-01-25 | 1.4 | 0.9 | -43.2 | 38.8 |
INN Growth Metrics
- The 4 year cash and equivalents growth rate now stands at 67.95%.
- Its 5 year net cashflow from operations growth rate is now at -12.82%.
- The 2 year net income to common stockholders growth rate now stands at -254.19%.

The table below shows INN's growth in key financial areas (numbers in millions of US dollars).
Date | Revenue | Operating Cash Flow | Net Income to Common Stock |
---|---|---|---|
2022-09-30 | 610.231 | 151.443 | -20.227 |
2022-06-30 | 542.665 | 138.124 | -30.674 |
2022-03-31 | 445.941 | 94.723 | -61.019 |
2021-12-31 | 361.926 | 66.051 | -83.714 |
2021-09-30 | 303.294 | 29.628 | -115.203 |
2021-06-30 | 245.02 | -6.391 | -142.495 |
INN's Quality Factors
The “Quality” component of the POWR Ratings focuses on 31 different factors of a companies fundamentals and operational strength. Here are some key insights as we drill into the specifics of these quality attributes.- INN has a Quality Grade of D, ranking ahead of 9.47% of graded US stocks.
- INN's asset turnover comes in at 0.136 -- ranking 136th of 444 Trading stocks.
- CLDT, APLE, and CDOR are the stocks whose asset turnover ratios are most correlated with INN.
The table below shows INN's key quality metrics over time.
Period | Asset Turnover | Gross Margin | ROIC |
---|---|---|---|
2021-09-30 | 0.136 | 0.413 | -0.016 |
2021-06-30 | 0.109 | 0.371 | -0.026 |
2021-03-31 | 0.081 | 0.296 | -0.035 |
2020-12-31 | 0.101 | 0.336 | -0.029 |
2020-09-30 | 0.136 | 0.392 | -0.013 |
2020-06-30 | 0.172 | 0.423 | 0.000 |
INN Price Target
For more insight on analysts targets of INN, see our INN price target page. And for a list of of all stocks sorted by upside potential based on analyst target price, see our Top Price Target page.
Average Price Target | $11.67 | Average Broker Recommendation | 1.58 (Moderate Buy) |
INN Stock Price Chart Interactive Chart >
INN Price/Volume Stats
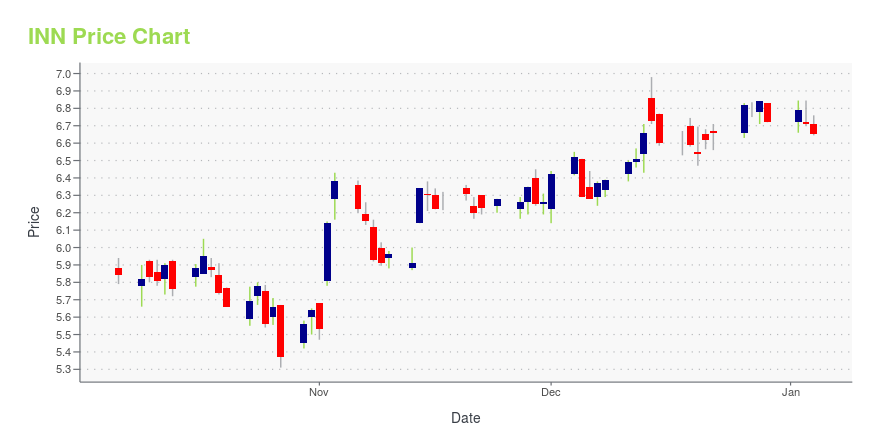
Current price | $8.64 | 52-week high | $10.58 |
Prev. close | $8.68 | 52-week low | $6.57 |
Day low | $8.53 | Volume | 1,072,000 |
Day high | $8.70 | Avg. volume | 586,835 |
50-day MA | $7.83 | Dividend yield | 1.85% |
200-day MA | $8.02 | Market Cap | 923.58M |
Summit Hotel Properties, Inc. (INN) Company Bio
Summit Hotel Properties, Inc. engages in acquiring, owning, renovating, repositioning, and asset-managing and selling premium-branded limited-service and select-service hotels in the upscale and midscale without food and beverage segments of the United States lodging industry. The company was founded in 2004 and is based in Sioux Falls, South Dakota.
Latest INN News From Around the Web
Below are the latest news stories about SUMMIT HOTEL PROPERTIES INC that investors may wish to consider to help them evaluate INN as an investment opportunity.
SUMMIT HOTEL PROPERTIES DECLARES FOURTH QUARTER 2022 DIVIDENDSAUSTIN, Texas, Jan. 26, 2023 /PRNewswire/ -- Summit Hotel Properties, Inc. (NYSE: INN) (the "Company"), announced today that its Board of Directors has authorized, and the Company has declared, a cash dividend for the fourth quarter ended December 31, 2022, of $0.04 per share of common… |
Summit Hotel Properties. – Consensus Indicates Potential 17.6% UpsideSummit Hotel Properties. with ticker code (INN) now have 5 analysts covering the stock with the consensus suggesting a rating of ''Hold''. The target price ranges between 11 and 8 with a mean TP of 9.3. With the stocks previous close at 7.91 this would indicate that there is a potential upside of 17.6%. There is a 50 day moving average of 7.81 while the 200 day moving average is 8.06. The company has a market capitalisation of $873m. Find out more information at: https://www.shpreit.com [stock_market_widget type="chart" template="basic" color="green" assets="INN" range="6mo" interval="1d" axes="true" cursor="true" api="yf"] The potential market cap would be $1,027m based on the market concensus. Summit Hotel Properties. is a publicly traded real estate investment trust focused on owning... |
SUMMIT HOTEL PROPERTIES ANNOUNCES FOURTH QUARTER AND FULL YEAR 2022 EARNINGS RELEASE DATEAUSTIN, Texas , Jan. 10, 2023 /PRNewswire/ -- Summit Hotel Properties, Inc. (NYSE: INN ) (the "Company") today announced that it will report financial results for the fourth quarter and full year of 2022 on Monday, February 27, 2023 , after the market closes. |
A stock that deserves closer examination: Summit Hotel Properties Inc. (INN)Within its last year performance, INN fell by -26.77%, with highs and lows ranging from $10.58 to $6.57, whereas the simple moving average fell by -12.52% in the last 200 days. On September 15, 2022, CapitalOne Downgraded Summit Hotel Properties Inc. (NYSE: INN) to Equal Weight. A report published by KeyBanc Capital Markets on July […] |
Shareholders in Summit Hotel Properties (NYSE:INN) are in the red if they invested five years agoFor many, the main point of investing is to generate higher returns than the overall market. But even the best stock... |
INN Price Returns
1-mo | 21.52% |
3-mo | 9.35% |
6-mo | 6.49% |
1-year | -7.91% |
3-year | -23.93% |
5-year | -30.91% |
YTD | 19.67% |
2022 | -25.33% |
2021 | 8.32% |
2020 | -25.87% |
2019 | 34.95% |
2018 | -32.54% |
INN Dividends
Ex-Dividend Date | Type | Payout Amount | Change | ||||||
---|---|---|---|---|---|---|---|---|---|
Loading, please wait... |
Continue Researching INN
Want to see what other sources are saying about Summit Hotel Properties Inc's financials and stock price? Try the links below:Summit Hotel Properties Inc (INN) Stock Price | Nasdaq
Summit Hotel Properties Inc (INN) Stock Quote, History and News - Yahoo Finance
Summit Hotel Properties Inc (INN) Stock Price and Basic Information | MarketWatch
Loading social stream, please wait...