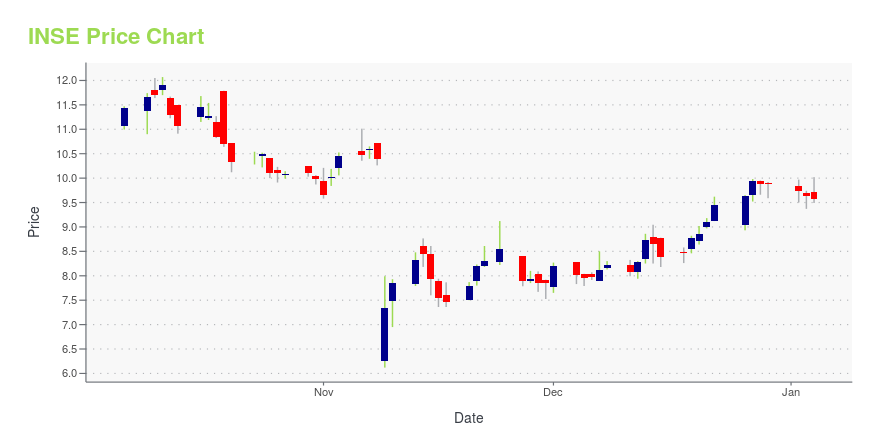
Inspired Entertainment, Inc. (INSE): Price and Financial Metrics
INSE Price/Volume Stats
| Current price | $9.01 | 52-week high | $11.61 |
| Prev. close | $9.21 | 52-week low | $6.51 |
| Day low | $8.95 | Volume | 117,200 |
| Day high | $9.30 | Avg. volume | 150,906 |
| 50-day MA | $8.38 | Dividend yield | N/A |
| 200-day MA | $0.00 | Market Cap | 242.41M |
INSE Stock Price Chart Interactive Chart >
Inspired Entertainment, Inc. (INSE) Company Bio
Inspired Entertainment, Inc., a games technology company, focuses on the development and sale of software systems and digital terminals worldwide. The company operates through two segments, Service Based Gaming (SBG) and Virtual Sports. The SBG segment designs, develops, markets, and distributes a portfolio of products and services through its digital network architecture to betting offices, casinos, gaming hall and bingo operators, and lotteries, as well as government affiliated and licensed operators. The Virtual Sports segment offers gaming software and content to regulated betting operators, lotteries, casinos, online operators, and other gaming and lottery operators. The company is based in London, the United Kingdom.
INSE Price Returns
| 1-mo | 7.39% |
| 3-mo | 19.50% |
| 6-mo | -10.53% |
| 1-year | -2.38% |
| 3-year | -12.86% |
| 5-year | 173.03% |
| YTD | -0.44% |
| 2024 | -8.40% |
| 2023 | -22.02% |
| 2022 | -2.24% |
| 2021 | 96.96% |
| 2020 | -2.52% |
Continue Researching INSE
Want to see what other sources are saying about Inspired Entertainment Inc's financials and stock price? Try the links below:Inspired Entertainment Inc (INSE) Stock Price | Nasdaq
Inspired Entertainment Inc (INSE) Stock Quote, History and News - Yahoo Finance
Inspired Entertainment Inc (INSE) Stock Price and Basic Information | MarketWatch


Loading social stream, please wait...