The Intergroup Corporation (INTG): Price and Financial Metrics
INTG Price/Volume Stats
Current price | $30.52 | 52-week high | $56.40 |
Prev. close | $32.00 | 52-week low | $30.00 |
Day low | $30.52 | Volume | 2,300 |
Day high | $31.50 | Avg. volume | 1,130 |
50-day MA | $35.30 | Dividend yield | N/A |
200-day MA | $44.27 | Market Cap | 67.36M |
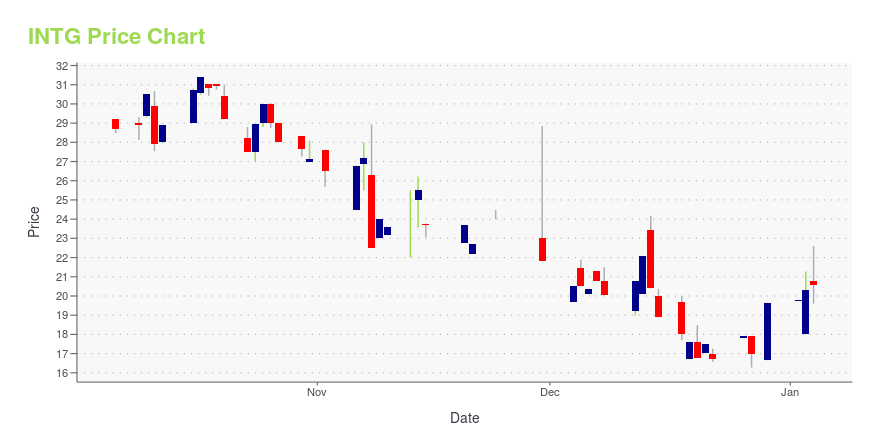
INTG Stock Price Chart Interactive Chart >
INTG Stock Summary
- The capital turnover (annual revenue relative to shareholder's equity) for INTG is -0.96 -- better than only 5.45% of US stocks.
- The ratio of debt to operating expenses for INTERGROUP CORP is higher than it is for about 97.15% of US stocks.
- INTG's equity multiplier -- a measure of assets relative to shareholders'equity -- is greater than that of only 4.9% of US stocks.
- If you're looking for stocks that are quantitatively similar to INTERGROUP CORP, a group of peers worth examining would be AHT, GLPI, ALX, AES, and GTN.
- INTG's SEC filings can be seen here. And to visit INTERGROUP CORP's official web site, go to www.intgla.com.
INTG Valuation Summary
- In comparison to the median Consumer Cyclical stock, INTG's price/sales ratio is 71.43% higher, now standing at 1.2.
- Over the past 243 months, INTG's price/earnings ratio has gone down 19.6.
Below are key valuation metrics over time for INTG.
Stock | Date | P/S | P/B | P/E | EV/EBIT |
---|---|---|---|---|---|
INTG | 2023-09-13 | 1.2 | -1.1 | -26.0 | 32.9 |
INTG | 2023-09-12 | 1.1 | -1.1 | -24.0 | 32.2 |
INTG | 2023-09-11 | 1.2 | -1.2 | -26.3 | 33.0 |
INTG | 2023-09-08 | 1.2 | -1.2 | -26.3 | 33.0 |
INTG | 2023-09-07 | 1.2 | -1.2 | -26.9 | 33.2 |
INTG | 2023-09-06 | 1.2 | -1.2 | -26.9 | 33.2 |
INTG Growth Metrics
- Its 5 year cash and equivalents growth rate is now at 102.71%.
- Its 5 year net cashflow from operations growth rate is now at -43.49%.
- Its 2 year net cashflow from operations growth rate is now at -156.59%.

The table below shows INTG's growth in key financial areas (numbers in millions of US dollars).
Date | Revenue | Operating Cash Flow | Net Income to Common Stock |
---|---|---|---|
2022-12-31 | 56.344 | 3.004 | -2.868 |
2022-09-30 | 52.686 | 0.139 | -6.761 |
2022-06-30 | 47.219 | 0.921 | -8.723 |
2022-03-31 | 40.312 | -4.816 | 0.184 |
2021-12-31 | 36.221 | -7.819 | 1.76 |
2021-09-30 | 32.67 | -9.753 | 3.698 |
Latest INTG News From Around the Web
Below are the latest news stories about INTERGROUP CORP that investors may wish to consider to help them evaluate INTG as an investment opportunity.
InterGroup (NASDAQ:INTG) shareholders have earned a 10% CAGR over the last three yearsThe InterGroup Corporation ( NASDAQ:INTG ) shareholders might be concerned after seeing the share price drop 22% in the... |
InterGroup Third Quarter 2023 Earnings: US$0.16 loss per share (vs US$0.21 loss in 3Q 2022)InterGroup ( NASDAQ:INTG ) Third Quarter 2023 Results Key Financial Results Revenue: US$14.4m (up 37% from 3Q 2022... |
The InterGroup Corporation (NASDAQ:INTG) insiders have significant skin in the game with 70% ownershipKey Insights Significant insider control over InterGroup implies vested interests in company growth John Winfield owns... |
InterGroup's (NASDAQ:INTG) investors will be pleased with their splendid 101% return over the last five yearsThe most you can lose on any stock (assuming you don't use leverage) is 100% of your money. But on the bright side, if... |
The InterGroup Corporation (NASDAQ:INTG) insiders have significant skin in the game with 69% ownershipA look at the shareholders of The InterGroup Corporation ( NASDAQ:INTG ) can tell us which group is most powerful. With... |
INTG Price Returns
1-mo | N/A |
3-mo | N/A |
6-mo | N/A |
1-year | N/A |
3-year | N/A |
5-year | -12.32% |
YTD | -35.24% |
2022 | -7.59% |
2021 | 61.29% |
2020 | -15.56% |
2019 | 16.37% |
2018 | 34.98% |
Continue Researching INTG
Want to see what other sources are saying about Intergroup Corp's financials and stock price? Try the links below:Intergroup Corp (INTG) Stock Price | Nasdaq
Intergroup Corp (INTG) Stock Quote, History and News - Yahoo Finance
Intergroup Corp (INTG) Stock Price and Basic Information | MarketWatch
Loading social stream, please wait...