Iron Mountain Inc. (IRM): Price and Financial Metrics
GET POWR RATINGS... FREE!
IRM POWR Grades
- IRM scores best on the Momentum dimension, with a Momentum rank ahead of 84.89% of US stocks.
- IRM's strongest trending metric is Momentum; it's been moving up over the last 179 days.
- IRM's current lowest rank is in the Sentiment metric (where it is better than 40% of US stocks).
IRM Stock Summary
- IRM has a higher market value than 85.54% of US stocks; more precisely, its current market capitalization is $15,975,436,159.
- Iron Mountain Inc's capital turnover -- a measure of revenue relative to shareholder's equity -- is better than 92.72% of US listed stocks.
- Equity multiplier, or assets relative to shareholders' equity, comes in at 14.46 for Iron Mountain Inc; that's greater than it is for 96.55% of US stocks.
- If you're looking for stocks that are quantitatively similar to Iron Mountain Inc, a group of peers worth examining would be MOS, BERY, NLSN, IAA, and CNK.
- IRM's SEC filings can be seen here. And to visit Iron Mountain Inc's official web site, go to www.ironmountain.com.
IRM Valuation Summary
- In comparison to the median Real Estate stock, IRM's price/sales ratio is 49.23% lower, now standing at 3.3.
- Over the past 243 months, IRM's price/sales ratio has gone up 1.4.
- Over the past 243 months, IRM's EV/EBIT ratio has gone down 5.7.
Below are key valuation metrics over time for IRM.
Stock | Date | P/S | P/B | P/E | EV/EBIT |
---|---|---|---|---|---|
IRM | 2021-09-02 | 3.3 | 12.5 | 23.6 | 21.6 |
IRM | 2021-09-01 | 3.3 | 12.2 | 23.1 | 21.3 |
IRM | 2021-08-31 | 3.2 | 12.0 | 22.8 | 21.2 |
IRM | 2021-08-30 | 3.1 | 11.8 | 22.3 | 20.9 |
IRM | 2021-08-27 | 3.1 | 11.7 | 22.1 | 20.8 |
IRM | 2021-08-26 | 3.1 | 11.6 | 21.9 | 20.7 |
IRM Growth Metrics
- Its year over year cash and equivalents growth rate is now at -9%.
- Its 4 year cash and equivalents growth rate is now at 29.45%.
- The 5 year cash and equivalents growth rate now stands at 29.45%.

The table below shows IRM's growth in key financial areas (numbers in millions of US dollars).
Date | Revenue | Operating Cash Flow | Net Income to Common Stock |
---|---|---|---|
2021-12-31 | 4,491.531 | 758.902 | 450.219 |
2021-09-30 | 4,391.597 | 823.776 | 635.981 |
2021-06-30 | 4,298.096 | 937.785 | 606.692 |
2021-03-31 | 4,160.579 | 931.071 | 324.321 |
2020-12-31 | 4,147.27 | 987.657 | 342.693 |
2020-09-30 | 4,167.207 | 945.728 | 132.983 |
IRM's Quality Factors
The “Quality” component of the POWR Ratings focuses on 31 different factors of a companies fundamentals and operational strength. Here are some key insights as we drill into the specifics of these quality attributes.- IRM has a Quality Grade of C, ranking ahead of 54.96% of graded US stocks.
- IRM's asset turnover comes in at 0.31 -- ranking 68th of 444 Trading stocks.
- LAMR, SAMG, and WHG are the stocks whose asset turnover ratios are most correlated with IRM.
The table below shows IRM's key quality metrics over time.
Period | Asset Turnover | Gross Margin | ROIC |
---|---|---|---|
2021-09-30 | 0.310 | 0.577 | 0.070 |
2021-06-30 | 0.307 | 0.579 | 0.068 |
2021-03-31 | 0.296 | 0.581 | 0.046 |
2020-12-31 | 0.297 | 0.576 | 0.047 |
2020-09-30 | 0.301 | 0.577 | 0.036 |
2020-06-30 | 0.303 | 0.575 | 0.042 |
IRM Price Target
For more insight on analysts targets of IRM, see our IRM price target page. And for a list of of all stocks sorted by upside potential based on analyst target price, see our Top Price Target page.
Average Price Target | $40.13 | Average Broker Recommendation | 1.71 (Moderate Buy) |
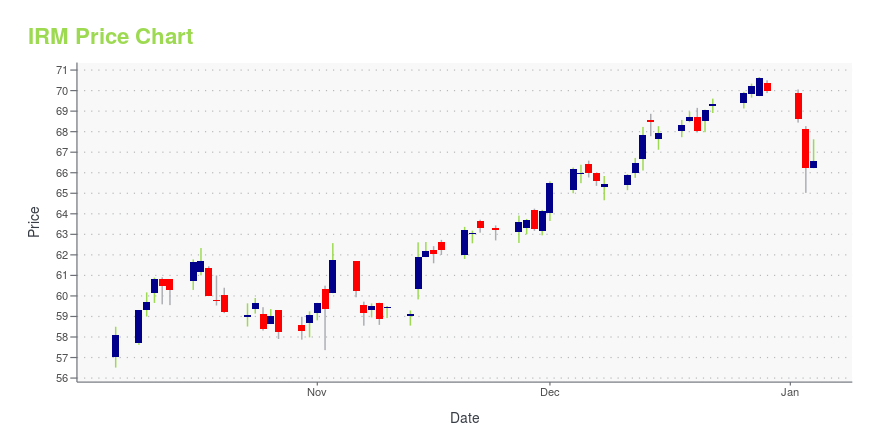
IRM Stock Price Chart Interactive Chart >
IRM Price/Volume Stats
Current price | $49.33 | 52-week high | $58.61 |
Prev. close | $48.69 | 52-week low | $41.67 |
Day low | $48.61 | Volume | 1,263,400 |
Day high | $49.58 | Avg. volume | 2,002,851 |
50-day MA | $51.68 | Dividend yield | 5.01% |
200-day MA | $48.89 | Market Cap | 14.33B |
Iron Mountain Inc. (IRM) Company Bio
Iron Mountain Inc. was founded in 1951 in Livingston, New York by Herman Knaust. Iron Mountain provides records, information management services, and data management services, along with the complex storage and information management such as rising storage rental costs, and increased litigation, and disaster recovery requirements. The company’s solutions serve several different industries including the banking, energy, entertainment, fine arts, healthcare, insurance, law firms, pharmaceutical, and retail sectors. Iron Mountain operates several data centers across the United States, Europe, and Asia in highly secure and compliant colocation facilities. William Meaney serves as President and Chief Executive Officer and the company is headquartered in Boston, Massachusetts.
Latest IRM News From Around the Web
Below are the latest news stories about Iron Mountain Inc that investors may wish to consider to help them evaluate IRM as an investment opportunity.
Iron Mountain stock rises as Stifel upgrades to buy on potential dividend hikeIron Mountain (NYSE:IRM) shares on Friday are climbing over 4% as Stifel analyst Shlomo Rosenbaum upgraded the stock on the basis of a potential dividend hike next year. "It appears investors are missing this key inflection point given the stock still screens very cheap and IRM shares remain a value play in... |
Iron Mountain Clocks 9 Percent Revenue Growth in Q4 Aided by Expanded Offerings, Resilient Storage BusinessesIron Mountain Inc. reported fourth-quarter FY21 revenue growth of 9 percent year-on-year to $1.16 billion, beating the consensus of $1.15 billion. Storage Rental Revenue grew 4 percent Y/Y to $725 million. Service Revenue rose 20 percent Y/Y to $434 million. The adjusted EBITDA margin expanded 180 bps to 37.1 percent. Adjusted EPS of $0.43 beat the […] |
Iron Mountain stock rises as Stifel upgrades to buy on potential dividend hike (NYSE:IRM)Iron Mountain (IRM) shares on Friday climb over 4% as Stifel analyst Shlomo Rosenbaum upgraded the stock on the basis of a potential dividend hike next year."It appears investors… |
Iron Mountain: Record Earnings, 5%+ Yield, 10% Growth In 2022No summary available. |
Friday Afternoon’s Top Analyst Upgrades and Downgrades: BP, Carvana, Iron Mountain, Latch, LivePerson and MoreFriday afternoon''s top analyst upgrades and downgrades included BP, Carvana, Iron Mountain, Latch and LivePerson. |
IRM Price Returns
1-mo | -7.12% |
3-mo | -11.14% |
6-mo | -1.43% |
1-year | 21.36% |
3-year | 89.58% |
5-year | 98.86% |
YTD | -3.33% |
2021 | 87.74% |
2020 | 0.97% |
2019 | 5.87% |
2018 | -7.98% |
2017 | 23.56% |
IRM Dividends
Ex-Dividend Date | Type | Payout Amount | Change | ||||||
---|---|---|---|---|---|---|---|---|---|
Loading, please wait... |
Continue Researching IRM
Want to see what other sources are saying about Iron Mountain Inc's financials and stock price? Try the links below:Iron Mountain Inc (IRM) Stock Price | Nasdaq
Iron Mountain Inc (IRM) Stock Quote, History and News - Yahoo Finance
Iron Mountain Inc (IRM) Stock Price and Basic Information | MarketWatch
Loading social stream, please wait...