
Insignia Systems, Inc. (ISIG): Price and Financial Metrics
ISIG Price/Volume Stats
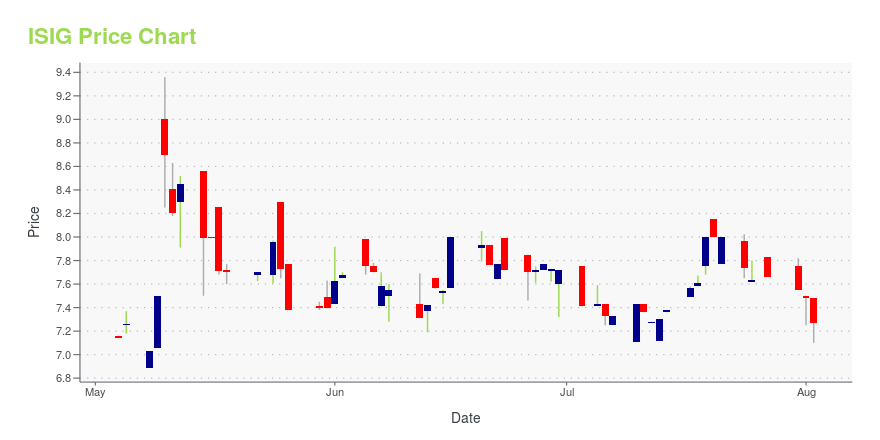
| Current price | $7.73 | 52-week high | $9.84 |
| Prev. close | $7.27 | 52-week low | $5.48 |
| Day low | $7.27 | Volume | 11,300 |
| Day high | $7.73 | Avg. volume | 5,829 |
| 50-day MA | $7.60 | Dividend yield | N/A |
| 200-day MA | $7.82 | Market Cap | 13.90M |
ISIG Stock Price Chart Interactive Chart >
Latest ISIG News From Around the Web
Below are the latest news stories about INSIGNIA SYSTEMS INC that investors may wish to consider to help them evaluate ISIG as an investment opportunity.
Insignia Systems, Inc. Closes Asset Sale of In-Store Marketing Business To Park Printing AffiliateLendway, Inc. (formerly, Insignia Systems, Inc.) (NASDAQ:LDWY) (the "Company") has closed the previously announced sale of its in-store marketing business to an affiliate of Park Printing for an aggregate cash purchase price of $3.5 million, subject to an escrow and certain post-closing adjustments. |
Insignia Systems, Inc. Announces Shareholder Approval of Sale of In-Store Marketing Business To Park Printing/ Insignia Systems, Inc. (NASDAQ:ISIG) ("the Company") today announced that its shareholders approved its previously announced agreement to sell its in-store marketing business to an affiliate of Park Printing, Inc. ("Park Printing") at the Company's annual meeting of shareholders held on July 27, 2023. |
Insignia Systems, Inc. Announces Agreement To Sell In-Store Marketing Business To Park PrintingInsignia Systems, Inc. (Nasdaq:ISIG) ("Insignia") and Park Printing, Inc. ("Park Printing") today announced entry into an agreement to sell Insignia's in-store marketing business to an affiliate of Park Printing for a gross cash purchase price of $3.5 million. |
Insignia Systems First Quarter 2023 Earnings: EPS: US$0.92 (vs US$0.035 in 1Q 2022)Insignia Systems ( NASDAQ:ISIG ) First Quarter 2023 Results Key Financial Results Revenue: US$12.8m (up 109% from 1Q... |
Insignia Systems, Inc. Announces First Quarter 2023 Financial ResultsInsignia Systems, Inc. (Nasdaq:ISIG) ("Insignia") today reported financial results for the first quarter ended March 31, 2023 ("Q1"). |
ISIG Price Returns
| 1-mo | N/A |
| 3-mo | N/A |
| 6-mo | N/A |
| 1-year | 0.91% |
| 3-year | -2.28% |
| 5-year | 10.43% |
| YTD | N/A |
| 2023 | 0.00% |
| 2022 | -66.16% |
| 2021 | 292.56% |
| 2020 | 15.04% |
| 2019 | -51.00% |
Continue Researching ISIG
Want to do more research on Insignia Systems Inc's stock and its price? Try the links below:Insignia Systems Inc (ISIG) Stock Price | Nasdaq
Insignia Systems Inc (ISIG) Stock Quote, History and News - Yahoo Finance
Insignia Systems Inc (ISIG) Stock Price and Basic Information | MarketWatch
Loading social stream, please wait...