iSun Inc. (ISUN): Price and Financial Metrics
ISUN Price/Volume Stats
Current price | $0.21 | 52-week high | $2.18 |
Prev. close | $0.18 | 52-week low | $0.13 |
Day low | $0.18 | Volume | 1,651,500 |
Day high | $0.22 | Avg. volume | 682,916 |
50-day MA | $0.19 | Dividend yield | N/A |
200-day MA | $0.51 | Market Cap | 7.81M |
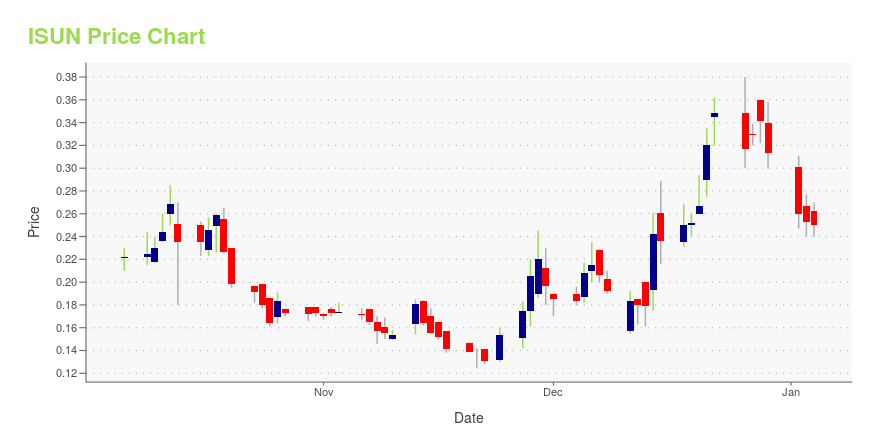
ISUN Stock Price Chart Interactive Chart >
ISUN Stock Summary
- With a market capitalization of $6,945,680, ISUN INC has a greater market value than just 4.2% of US stocks.
- With a price/sales ratio of 0.07, ISUN INC has a higher such ratio than merely 1.64% of stocks in our set.
- ISUN INC's shareholder yield -- a measure of how much capital is returned to stockholders via dividends and buybacks -- is -168.95%, greater than the shareholder yield of merely 2.78% of stocks in our set.
- Stocks that are quantitatively similar to ISUN, based on their financial statements, market capitalization, and price volatility, are CVLG, CPA, LBRT, WOW, and CMAX.
- ISUN's SEC filings can be seen here. And to visit ISUN INC's official web site, go to www.isunenergy.com.
ISUN Valuation Summary
- In comparison to the median Technology stock, ISUN's price/earnings ratio is 100.78% lower, now standing at -0.2.
- Over the past 94 months, ISUN's price/earnings ratio has gone up 405.2.
Below are key valuation metrics over time for ISUN.
Stock | Date | P/S | P/B | P/E | EV/EBIT |
---|---|---|---|---|---|
ISUN | 2023-11-28 | 0.1 | 0.3 | -0.2 | -0.4 |
ISUN | 2023-11-27 | 0.1 | 0.3 | -0.1 | -0.4 |
ISUN | 2023-11-24 | 0.1 | 0.3 | -0.1 | -0.4 |
ISUN | 2023-11-22 | 0.1 | 0.2 | -0.1 | -0.3 |
ISUN | 2023-11-21 | 0.1 | 0.2 | -0.1 | -0.3 |
ISUN | 2023-11-20 | 0.1 | 0.2 | -0.1 | -0.3 |
ISUN Growth Metrics
- Its 4 year net cashflow from operations growth rate is now at -1052.9%.
- Its 3 year cash and equivalents growth rate is now at 1544.66%.
- Its year over year revenue growth rate is now at 118.42%.

The table below shows ISUN's growth in key financial areas (numbers in millions of US dollars).
Date | Revenue | Operating Cash Flow | Net Income to Common Stock |
---|---|---|---|
2022-09-30 | 77.61572 | -4.591727 | -14.6674 |
2022-06-30 | 65.2607 | -5.773728 | -10.38922 |
2022-03-31 | 53.138 | -6.855247 | -6.032645 |
2021-12-31 | 45.31166 | -5.19529 | -6.310641 |
2021-09-30 | 27.62422 | -5.243645 | -4.465956 |
2021-06-30 | 25.91127 | -3.488623 | -4.501371 |
ISUN's Quality Factors
The “Quality” component of the POWR Ratings focuses on 31 different factors of a companies fundamentals and operational strength. Here are some key insights as we drill into the specifics of these quality attributes.- ISUN has a Quality Grade of F, ranking ahead of 3.05% of graded US stocks.
- ISUN's asset turnover comes in at 0.753 -- ranking 92nd of 208 Electronic Equipment stocks.
- SOFO, DZSI, and SWIR are the stocks whose asset turnover ratios are most correlated with ISUN.
The table below shows ISUN's key quality metrics over time.
Period | Asset Turnover | Gross Margin | ROIC |
---|---|---|---|
2021-06-30 | 0.753 | 0.058 | -0.219 |
2021-03-31 | 0.878 | 0.088 | -0.134 |
2020-12-31 | 1.084 | 0.111 | -0.011 |
2020-09-30 | 0.980 | 0.039 | -0.125 |
2020-06-30 | 1.441 | 0.077 | -0.081 |
2020-03-31 | 1.808 | 0.119 | 0.026 |
ISUN Price Target
For more insight on analysts targets of ISUN, see our ISUN price target page. And for a list of of all stocks sorted by upside potential based on analyst target price, see our Top Price Target page.
Average Price Target | $28.00 | Average Broker Recommendation | 1.5 (Moderate Buy) |
iSun Inc. (ISUN) Company Bio
iSun, Inc. operates as a solar engineering, construction, and procurement contractor for commercial and industrial customers in the Northeastern United States. It also provides electrical contracting services; and data and communication services. The company was formerly known as The Peck Company Holdings, Inc. and changed its name to iSun, Inc. in January 2021. iSun, Inc. was founded in 1972 and is headquartered in South Burlington, Vermont.
Latest ISUN News From Around the Web
Below are the latest news stories about ISUN INC that investors may wish to consider to help them evaluate ISUN as an investment opportunity.
iSun, Inc. (NASDAQ:ISUN) Q3 2023 Earnings Call TranscriptiSun, Inc. (NASDAQ:ISUN) Q3 2023 Earnings Call Transcript November 14, 2023 Operator: Greetings. Welcome to the iSun Energy Third Quarter 2023 Earnings Conference Call. At this time, all participants are in a listen-only mode. A question-and-answer session will follow the formal presentation. [Operator Instructions]. Please note, this conference is being recorded. I will now turn […] |
Today’s Biggest Pre-Market Stock Movers: 10 Top Gainers and Losers on ThursdayIt's time to start the day with a breakdown of the biggest pre-market stock movers worth keeping an eye on for Thursday! |
Four Solar Sector Stocks Set To Soar in 2024The solar industry has been on a remarkable upward trajectory in the last decade, witnessing an annual growth rate of 24%. Factors like federal policies, cost reductions, and a growing demand for c... |
iSun Inc. Reports Third Quarter 2023 ResultsWILLISTON, Vt., November 14, 2023--iSun, Inc. (NASDAQ: ISUN) (the "Company," or "iSun"), a leading solar energy and clean mobility infrastructure company with 50 years of experience accelerating the adoption of innovative electrical technologies, today announced financial results for the third quarter of 2023 ended September 30, 2023. |
iSun Inc. Announces Timing for Third Quarter 2023 Conference Call and WebcastWILLISTON, Vt., November 06, 2023--iSun, Inc. (NASDAQ: ISUN) (the "Company," or "iSun"), a leading solar energy and clean mobility infrastructure company with 50-years of experience accelerating the adoption of innovative electrical technologies, today announced that it will issue financial results for the third quarter and nine months ended September 30, 2023, before the market opens on Tuesday, November 14, 2023. |
ISUN Price Returns
1-mo | 20.69% |
3-mo | -34.48% |
6-mo | -62.22% |
1-year | -87.20% |
3-year | -96.57% |
5-year | N/A |
YTD | -84.33% |
2022 | -77.52% |
2021 | 0.17% |
2020 | N/A |
2019 | N/A |
2018 | N/A |
Loading social stream, please wait...