Gartner Inc. (IT): Price and Financial Metrics
GET POWR RATINGS... FREE!
IT POWR Grades
- Quality is the dimension where IT ranks best; there it ranks ahead of 95.53% of US stocks.
- The strongest trend for IT is in Quality, which has been heading down over the past 179 days.
- IT ranks lowest in Momentum; there it ranks in the 10th percentile.
IT Stock Summary
- GARTNER INC's capital turnover -- a measure of revenue relative to shareholder's equity -- is better than 98.57% of US listed stocks.
- IT's one year PEG ratio, measuring expected growth in earnings next year relative to current common stock price is 511.35 -- higher than 94.31% of US-listed equities with positive expected earnings growth.
- IT's equity multiplier -- a measure of assets relative to shareholders'equity -- is greater than that of 99.82% of US stocks.
- Stocks that are quantitatively similar to IT, based on their financial statements, market capitalization, and price volatility, are APO, FTDR, WMG, BGI, and JWN.
- Visit IT's SEC page to see the company's official filings. To visit the company's web site, go to www.gartner.com.
IT Valuation Summary
- In comparison to the median Technology stock, IT's price/sales ratio is 80% higher, now standing at 4.5.
- IT's price/earnings ratio has moved up 18.4 over the prior 243 months.
Below are key valuation metrics over time for IT.
Stock | Date | P/S | P/B | P/E | EV/EBIT |
---|---|---|---|---|---|
IT | 2023-03-21 | 4.5 | 109.0 | 30.7 | 23.6 |
IT | 2023-03-20 | 4.4 | 106.9 | 30.2 | 23.2 |
IT | 2023-03-17 | 4.4 | 105.0 | 29.6 | 22.8 |
IT | 2023-03-16 | 4.4 | 106.2 | 29.9 | 23.0 |
IT | 2023-03-15 | 4.5 | 107.9 | 30.4 | 23.4 |
IT | 2023-03-14 | 4.6 | 111.2 | 31.4 | 24.0 |
IT Growth Metrics
- The 3 year cash and equivalents growth rate now stands at 205.6%.
- The 4 year cash and equivalents growth rate now stands at -81.44%.
- The 4 year net income to common stockholders growth rate now stands at 58.62%.

The table below shows IT's growth in key financial areas (numbers in millions of US dollars).
Date | Revenue | Operating Cash Flow | Net Income to Common Stock |
---|---|---|---|
2022-09-30 | 5,277.452 | 1,133.099 | 760.344 |
2022-06-30 | 5,101.866 | 1,163.217 | 735.664 |
2022-03-31 | 4,892.664 | 1,322.957 | 801.975 |
2021-12-31 | 4,733.962 | 1,312.47 | 793.56 |
2021-09-30 | 4,540.398 | 1,338.132 | 703.808 |
2021-06-30 | 4,378.734 | 1,237.006 | 571.907 |
IT's Quality Factors
The “Quality” component of the POWR Ratings focuses on 31 different factors of a companies fundamentals and operational strength. Here are some key insights as we drill into the specifics of these quality attributes.- IT has a Quality Grade of A, ranking ahead of 97.45% of graded US stocks.
- IT's asset turnover comes in at 0.639 -- ranking 251st of 561 Business Services stocks.
- ASPS, MEDP, and LTBR are the stocks whose asset turnover ratios are most correlated with IT.
The table below shows IT's key quality metrics over time.
Period | Asset Turnover | Gross Margin | ROIC |
---|---|---|---|
2021-09-30 | 0.639 | 0.693 | 0.381 |
2021-06-30 | 0.619 | 0.688 | 0.316 |
2021-03-31 | 0.600 | 0.680 | 0.203 |
2020-12-31 | 0.591 | 0.672 | 0.152 |
2020-09-30 | 0.607 | 0.655 | 0.131 |
2020-06-30 | 0.610 | 0.647 | 0.140 |
IT Price Target
For more insight on analysts targets of IT, see our IT price target page. And for a list of of all stocks sorted by upside potential based on analyst target price, see our Top Price Target page.
Average Price Target | $311.86 | Average Broker Recommendation | 1.5 (Moderate Buy) |
IT Stock Price Chart Interactive Chart >
IT Price/Volume Stats
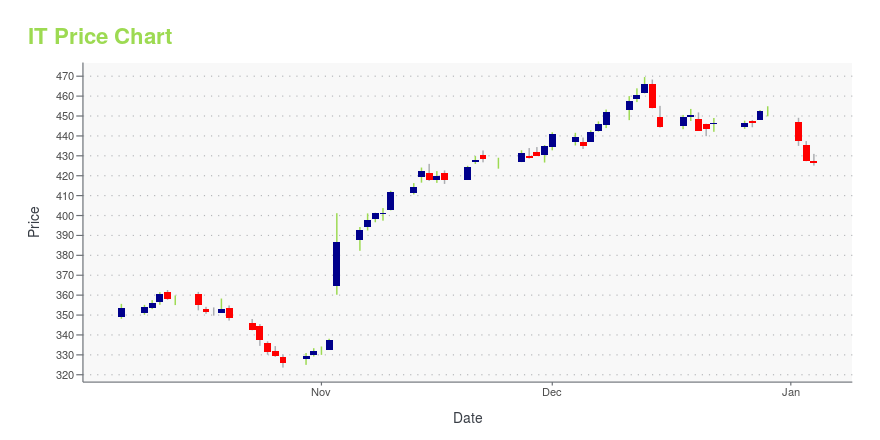
Current price | $312.11 | 52-week high | $358.25 |
Prev. close | $308.54 | 52-week low | $221.39 |
Day low | $302.03 | Volume | 427,900 |
Day high | $312.26 | Avg. volume | 466,247 |
50-day MA | $331.61 | Dividend yield | N/A |
200-day MA | $305.15 | Market Cap | 24.68B |
Gartner Inc. (IT) Company Bio
Gartner, Inc is a technological research and consulting firm based in Stamford, Connecticut that conducts research on technology and shares this research both through private consulting as well as executive programs and conferences. Its clients include large corporations, government agencies, technology companies, and investment firms. (Source:Wikipedia)
Latest IT News From Around the Web
Below are the latest news stories about GARTNER INC that investors may wish to consider to help them evaluate IT as an investment opportunity.
Zacks Industry Outlook Highlights Gartner, CBIZ and Huron Consulting GroupGartner, CBIZ and Huron Consulting Group are part of the Zacks Industry Outlook article. |
3 Stocks From the Booming Consulting Services IndustryWith service activities remaining healthy, the Zacks Consulting Services industry is poised to prosper. IT, CBZ and HURN are three stocks well-placed to ride the demand strength. |
Gartner's (NYSE:IT) three-year total shareholder returns outpace the underlying earnings growthThe worst result, after buying shares in a company (assuming no leverage), would be if you lose all the money you put... |
HCKT or IT: Which Is the Better Value Stock Right Now?HCKT vs. IT: Which Stock Is the Better Value Option? |
Gartner Announces Keynote Speakers at 2023 Gartner CSO & Sales Leader ConferenceSTAMFORD, Conn., March 15, 2023--Gartner, Inc. (NYSE: IT): |
IT Price Returns
1-mo | -6.09% |
3-mo | N/A |
6-mo | 13.51% |
1-year | 5.65% |
3-year | 196.91% |
5-year | 165.38% |
YTD | -7.15% |
2022 | 0.54% |
2021 | 108.70% |
2020 | 3.95% |
2019 | 20.54% |
2018 | 3.81% |
Continue Researching IT
Want to do more research on Gartner Inc's stock and its price? Try the links below:Gartner Inc (IT) Stock Price | Nasdaq
Gartner Inc (IT) Stock Quote, History and News - Yahoo Finance
Gartner Inc (IT) Stock Price and Basic Information | MarketWatch
Loading social stream, please wait...