
Ituran Location & Control Ltd. (ITRN): Price and Financial Metrics
ITRN Price/Volume Stats
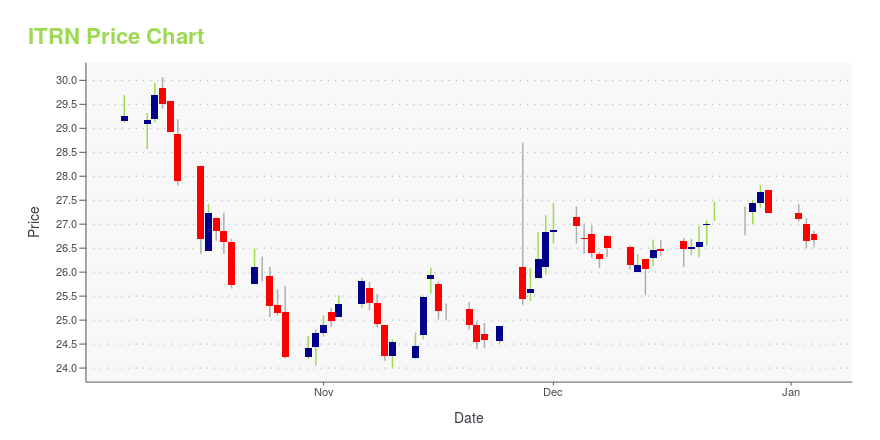
| Current price | $26.49 | 52-week high | $31.01 |
| Prev. close | $26.39 | 52-week low | $24.01 |
| Day low | $26.41 | Volume | 34,400 |
| Day high | $26.94 | Avg. volume | 49,087 |
| 50-day MA | $26.02 | Dividend yield | 5.89% |
| 200-day MA | $26.27 | Market Cap | 526.99M |
ITRN Stock Price Chart Interactive Chart >
Ituran Location & Control Ltd. (ITRN) Company Bio
Ituran Location and Control Ltd. provides location-based services and wireless communication products in Israel, Brazil, Argentina, and the United States. The companys Location-Based Services segment provides stolen vehicle recovery and tracking services, which enable customers to locate, track, and recover stolen vehicles for its subscribers; fleet management services that enable corporate and individual customers to track and manage their vehicles in real time; and personal locator services that allow customers to protect valuable merchandise and equipment. The company was founded in 1994 and is based in Azour, Israel.
Latest ITRN News From Around the Web
Below are the latest news stories about ITURAN LOCATION & CONTROL LTD that investors may wish to consider to help them evaluate ITRN as an investment opportunity.
There's A Lot To Like About Ituran Location and Control's (NASDAQ:ITRN) Upcoming US$0.24 DividendSome investors rely on dividends for growing their wealth, and if you're one of those dividend sleuths, you might be... |
Ituran Location and Control's (NASDAQ:ITRN) Upcoming Dividend Will Be Larger Than Last Year'sIturan Location and Control Ltd. ( NASDAQ:ITRN ) will increase its dividend from last year's comparable payment on the... |
Ituran Location and Control Ltd. (NASDAQ:ITRN) Q3 2023 Earnings Call TranscriptIturan Location and Control Ltd. (NASDAQ:ITRN) Q3 2023 Earnings Call Transcript November 27, 2023 Operator: Ladies and gentlemen, thank you for standing by. Welcome to the Ituran Third Quarter 2023 Results Conference Call. All participants are present in listen-only mode. Following management’s formal presentation, instructions will be given for the question-and-answer session. [Operator Instructions] As […] |
/C O R R E C T I O N -- Ituran Location and Control Ltd./Ituran Location and Control Ltd. (NASDAQ: ITRN) announced that the Board of Directors approved the distribution of a cash dividend in the amount of $0.24 per share, totaling approximately US$5 million. The dividend will be paid to shareholders of record as of December 20, 2023. The Company will pay the dividend out on January 4, 2024 net of taxes at the rate of 25%. |
ITURAN PRESENTS THIRD QUARTER 2023 RESULTSIturan Location and Control Ltd. (NASDAQ: ITRN), today announced its consolidated financial results for the third quarter of 2023. |
ITRN Price Returns
| 1-mo | 7.12% |
| 3-mo | 4.71% |
| 6-mo | 6.66% |
| 1-year | -0.35% |
| 3-year | 19.89% |
| 5-year | 3.05% |
| YTD | 0.09% |
| 2023 | 32.25% |
| 2022 | -19.29% |
| 2021 | 44.74% |
| 2020 | -22.93% |
| 2019 | -18.98% |
ITRN Dividends
| Ex-Dividend Date | Type | Payout Amount | Change | ||||||
|---|---|---|---|---|---|---|---|---|---|
| Loading, please wait... | |||||||||
Continue Researching ITRN
Want to do more research on Ituran Location & Control Ltd's stock and its price? Try the links below:Ituran Location & Control Ltd (ITRN) Stock Price | Nasdaq
Ituran Location & Control Ltd (ITRN) Stock Quote, History and News - Yahoo Finance
Ituran Location & Control Ltd (ITRN) Stock Price and Basic Information | MarketWatch
Loading social stream, please wait...