Johnson Controls International PLC (JCI): Price and Financial Metrics
GET POWR RATINGS... FREE!
JCI POWR Grades
- JCI scores best on the Growth dimension, with a Growth rank ahead of 81.7% of US stocks.
- The strongest trend for JCI is in Momentum, which has been heading up over the past 177 days.
- JCI ranks lowest in Quality; there it ranks in the 47th percentile.
JCI Stock Summary
- JCI has a higher market value than 94.47% of US stocks; more precisely, its current market capitalization is $40,017,462,062.
- JCI's went public 37.26 years ago, making it older than 93.5% of listed US stocks we're tracking.
- The price/operating cash flow metric for JOHNSON CONTROLS INTERNATIONAL PLC is higher than 85.12% of stocks in our set with a positive cash flow.
- If you're looking for stocks that are quantitatively similar to JOHNSON CONTROLS INTERNATIONAL PLC, a group of peers worth examining would be AJG, ODFL, COF, EMR, and NTR.
- JCI's SEC filings can be seen here. And to visit JOHNSON CONTROLS INTERNATIONAL PLC's official web site, go to www.johnsoncontrols.com.
JCI Valuation Summary
- JCI's price/earnings ratio is 31; this is 62.3% higher than that of the median Industrials stock.
- Over the past 243 months, JCI's price/earnings ratio has gone up 20.2.
Below are key valuation metrics over time for JCI.
Stock | Date | P/S | P/B | P/E | EV/EBIT |
---|---|---|---|---|---|
JCI | 2023-03-17 | 1.5 | 2.5 | 31.0 | 33.4 |
JCI | 2023-03-16 | 1.6 | 2.5 | 32.2 | 34.4 |
JCI | 2023-03-15 | 1.6 | 2.5 | 31.9 | 34.2 |
JCI | 2023-03-14 | 1.7 | 2.7 | 33.9 | 35.9 |
JCI | 2023-03-13 | 1.6 | 2.6 | 32.8 | 34.9 |
JCI | 2023-03-10 | 1.7 | 2.6 | 33.3 | 35.4 |
JCI Growth Metrics
- Its 5 year revenue growth rate is now at -30.3%.
- Its 3 year net income to common stockholders growth rate is now at -47.76%.
- The 5 year net income to common stockholders growth rate now stands at 952.72%.

The table below shows JCI's growth in key financial areas (numbers in millions of US dollars).
Date | Revenue | Operating Cash Flow | Net Income to Common Stock |
---|---|---|---|
2022-12-31 | 25,505 | 1,302 | 1,269 |
2022-09-30 | 25,299 | 1,986 | 1,532 |
2022-06-30 | 24,966 | 1,328 | 1,040 |
2022-03-31 | 24,693 | 1,684 | 1,235 |
2021-12-31 | 24,189 | 2,396 | 1,567 |
2021-09-30 | 23,668 | 2,487 | 1,637 |
JCI's Quality Factors
The “Quality” component of the POWR Ratings focuses on 31 different factors of a companies fundamentals and operational strength. Here are some key insights as we drill into the specifics of these quality attributes.- JCI has a Quality Grade of C, ranking ahead of 52.62% of graded US stocks.
- JCI's asset turnover comes in at 0.561 -- ranking 287th of 563 Business Services stocks.
- INOD, BLKB, and ADS are the stocks whose asset turnover ratios are most correlated with JCI.
The table below shows JCI's key quality metrics over time.
Period | Asset Turnover | Gross Margin | ROIC |
---|---|---|---|
2021-06-30 | 0.561 | 0.338 | 0.161 |
2021-03-31 | 0.540 | 0.336 | 0.107 |
2020-12-31 | 0.539 | 0.332 | 0.088 |
2020-09-30 | 0.541 | 0.332 | 0.069 |
2020-06-30 | 0.544 | 0.328 | 0.034 |
2020-03-31 | 0.564 | 0.325 | 0.376 |
JCI Price Target
For more insight on analysts targets of JCI, see our JCI price target page. And for a list of of all stocks sorted by upside potential based on analyst target price, see our Top Price Target page.
Average Price Target | $79.38 | Average Broker Recommendation | 1.55 (Moderate Buy) |
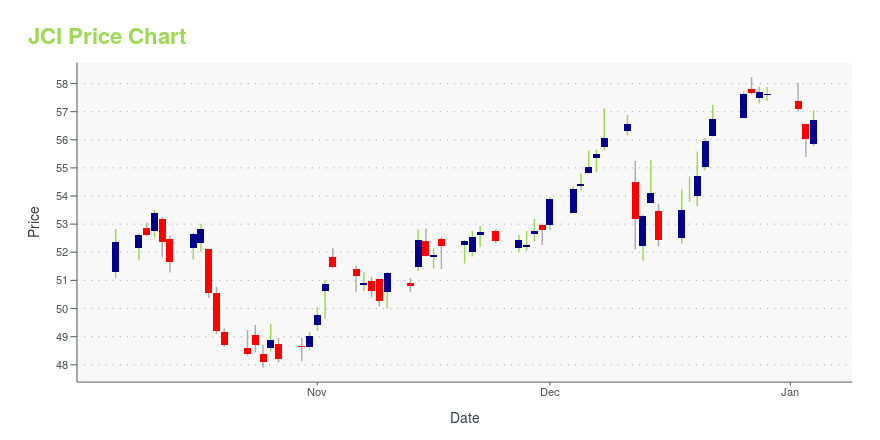
JCI Stock Price Chart Interactive Chart >
JCI Price/Volume Stats
Current price | $59.39 | 52-week high | $69.60 |
Prev. close | $59.56 | 52-week low | $45.52 |
Day low | $59.27 | Volume | 1,742,025 |
Day high | $60.36 | Avg. volume | 3,608,128 |
50-day MA | $63.48 | Dividend yield | 2.44% |
200-day MA | $58.68 | Market Cap | 36.71B |
Johnson Controls International PLC (JCI) Company Bio
Johnson Controls International is an American Irish-domiciled multinational conglomerate headquartered in Cork, Ireland, that produces fire, HVAC, and security equipment for buildings. As of mid-2019, it employed 105,000 people in around 2,000 locations across six continents. As of 2017, it was listed as 389th in the Fortune Global 500; in 2017, it became ineligible for the Fortune 500, as it was headquartered outside the U.S. (Source:Wikipedia)
Latest JCI News From Around the Web
Below are the latest news stories about JOHNSON CONTROLS INTERNATIONAL PLC that investors may wish to consider to help them evaluate JCI as an investment opportunity.
Are Poor Financial Prospects Dragging Down Johnson Controls International plc (NYSE:JCI Stock?It is hard to get excited after looking at Johnson Controls International's (NYSE:JCI) recent performance, when its... |
Here's Why You Must Hold on to Johnson Controls (JCI) NowStrength in the Building Solutions North America segment, pricing actions and investments in digital offerings are key catalysts to Johnson Controls' (JCI) growth. |
Ethisphere Names Johnson Controls as One of the World's Most Ethical Companies for the 16th YearJohnson Controls (NYSE: JCI), the global leader for smart, healthy, and sustainable buildings, has been recognized by Ethisphere as one of the World's Most Ethical Companies in 2023, marking the 16th time Johnson Controls has been named to this list. The 2023 list recognized 135 honorees spanning 19 countries and 48 industries. |
5 Stocks in Focus on Their Recent Dividend HikeFive stocks that have recently raised their dividend are: DKS, JCI, AXP, TNL and GPRK. |
Building managers can digitally assess carbon footprints, set emissions targets, manage emissions, and track progress for reportingFinally, building managers can put away the complicated spreadsheets, and use a single digital dashboard to assess carbon footprints, set targets, and manage and track emissions. Johnson Controls (NYSE: JCI), the global leader for smart, healthy, sustainable buildings, announces Johnson Controls OpenBlue Net Zero Advisor, which uses digitally automated data collection and analytics to manage and track scope 1 and 2 emissions and assist building owners in reporting for certification and complianc |
JCI Price Returns
1-mo | -4.73% |
3-mo | -6.64% |
6-mo | 22.06% |
1-year | -9.05% |
3-year | 139.77% |
5-year | 90.84% |
YTD | -6.64% |
2022 | -19.29% |
2021 | 77.42% |
2020 | 17.70% |
2019 | 40.91% |
2018 | -19.85% |
JCI Dividends
Ex-Dividend Date | Type | Payout Amount | Change | ||||||
---|---|---|---|---|---|---|---|---|---|
Loading, please wait... |
Continue Researching JCI
Want to see what other sources are saying about Johnson Controls International plc's financials and stock price? Try the links below:Johnson Controls International plc (JCI) Stock Price | Nasdaq
Johnson Controls International plc (JCI) Stock Quote, History and News - Yahoo Finance
Johnson Controls International plc (JCI) Stock Price and Basic Information | MarketWatch
Loading social stream, please wait...