Jefferies Financial Group Inc. (JEF): Price and Financial Metrics
GET POWR RATINGS... FREE!
JEF POWR Grades
- Momentum is the dimension where JEF ranks best; there it ranks ahead of 96.87% of US stocks.
- The strongest trend for JEF is in Momentum, which has been heading up over the past 177 days.
- JEF ranks lowest in Sentiment; there it ranks in the 10th percentile.
JEF Stock Summary
- JEFFERIES FINANCIAL GROUP INC's stock had its IPO on November 5, 1987, making it an older stock than 91.53% of US equities in our set.
- As for revenue growth, note that JEF's revenue has grown -26.96% over the past 12 months; that beats the revenue growth of merely 7.39% of US companies in our set.
- JEFFERIES FINANCIAL GROUP INC's shareholder yield -- a measure of how much capital is returned to stockholders via dividends and buybacks -- is 43.71%, greater than the shareholder yield of 95.68% of stocks in our set.
- If you're looking for stocks that are quantitatively similar to JEFFERIES FINANCIAL GROUP INC, a group of peers worth examining would be ONB, WAFD, BAP, CFR, and KEY.
- JEF's SEC filings can be seen here. And to visit JEFFERIES FINANCIAL GROUP INC's official web site, go to www.jefferies.com.
JEF Valuation Summary
- JEF's price/earnings ratio is 8.7; this is 8.42% lower than that of the median Financial Services stock.
- Over the past 243 months, JEF's EV/EBIT ratio has gone up 10.2.
Below are key valuation metrics over time for JEF.
Stock | Date | P/S | P/B | P/E | EV/EBIT |
---|---|---|---|---|---|
JEF | 2023-03-17 | 1.1 | 0.7 | 8.7 | 25.0 |
JEF | 2023-03-16 | 1.2 | 0.7 | 9.1 | 25.3 |
JEF | 2023-03-15 | 1.2 | 0.7 | 9.0 | 25.2 |
JEF | 2023-03-14 | 1.2 | 0.7 | 9.3 | 25.5 |
JEF | 2023-03-13 | 1.2 | 0.7 | 8.9 | 25.1 |
JEF | 2023-03-10 | 1.2 | 0.7 | 9.6 | 25.7 |
JEF's Quality Factors
The “Quality” component of the POWR Ratings focuses on 31 different factors of a companies fundamentals and operational strength. Here are some key insights as we drill into the specifics of these quality attributes.- JEF has a Quality Grade of C, ranking ahead of 34.64% of graded US stocks.
- JEF's asset turnover comes in at 0.146 -- ranking 123rd of 444 Trading stocks.
- MPW, STAG, and ACRE are the stocks whose asset turnover ratios are most correlated with JEF.
The table below shows JEF's key quality metrics over time.
Period | Asset Turnover | Gross Margin | ROIC |
---|---|---|---|
2021-08-31 | 0.146 | 0.905 | 0.030 |
2021-05-31 | 0.144 | 0.910 | 0.029 |
2021-02-28 | 0.134 | 0.909 | 0.024 |
2020-11-30 | 0.116 | 0.899 | 0.016 |
2020-08-31 | 0.103 | 0.889 | 0.014 |
2020-05-31 | 0.090 | 0.873 | 0.009 |
JEF Price Target
For more insight on analysts targets of JEF, see our JEF price target page. And for a list of of all stocks sorted by upside potential based on analyst target price, see our Top Price Target page.
Average Price Target | $41.00 | Average Broker Recommendation | 1.33 (Strong Buy) |
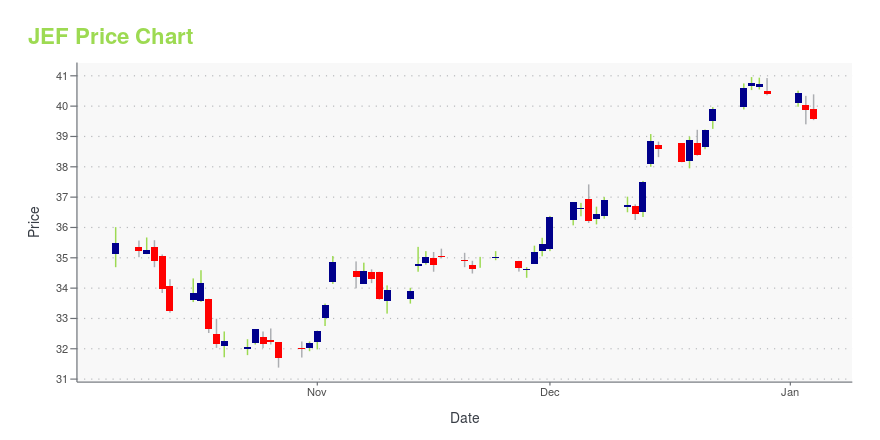
JEF Stock Price Chart Interactive Chart >
JEF Price/Volume Stats
Current price | $30.98 | 52-week high | $40.80 |
Prev. close | $31.14 | 52-week low | $25.88 |
Day low | $30.69 | Volume | 1,734,219 |
Day high | $31.69 | Avg. volume | 1,691,358 |
50-day MA | $36.05 | Dividend yield | 3.97% |
200-day MA | $33.84 | Market Cap | 7.05B |
Jefferies Financial Group Inc. (JEF) Company Bio
Jefferies Financial Group (formerly Leucadia National Corporation) operates in the investment banking and capital markets sector. Leucadia The company also owns and holds investments in various other businesses, including beef processing, manufacturing, energy projects, asset management, and real estate. The company was founded in 1968 and is based in New York, New York.
Latest JEF News From Around the Web
Below are the latest news stories about JEFFERIES FINANCIAL GROUP INC that investors may wish to consider to help them evaluate JEF as an investment opportunity.
Jefferies (JEF) Q1 Earnings Beat Estimates on Lower ExpensesA fall in expenses and better-than-expected capital markets performance support Jefferies' (JEF) fiscal Q1 earnings. |
Jefferies (JEF) Q1 Earnings and Revenues Beat EstimatesJefferies (JEF) delivered earnings and revenue surprises of 14.58% and 5.95%, respectively, for the quarter ended February 2023. Do the numbers hold clues to what lies ahead for the stock? |
UPDATE 2-Jefferies profit drops less than feared on capital markets strengthInvestment bank Jefferies Financial Group Inc on Tuesday reported a smaller-than-expected drop in profit for the first quarter as strength in its capital markets business helped cushion a lull in dealmaking. After a stellar run in 2021, U.S. investment banking giants struggled for most of last year as the Federal Reserve's aggressive monetary tightening raised borrowing costs in a blow to corporate appetite for deals. The capital markets unit benefited from the rise in volatility, however, as investors rejigged portfolios to hedge against risk. |
Jefferies profit drops less than feared on capital markets strengthAfter a stellar run in 2021, U.S. investment banking giants struggled for most of last year as the Federal Reserve's aggressive monetary tightening raised borrowing costs in a blow to corporate appetite for deals. The capital markets unit benefited from the rise in volatility, however, as investors rejigged portfolios to hedge against risk. Total net revenue still dropped 24% to $1.28 billion, hit by declines in the asset management and investment banking units. |
Jefferies Announces First Quarter 2023 Financial ResultsNEW YORK, March 28, 2023--Jefferies Financial Group Inc. (NYSE: JEF): |
JEF Price Returns
1-mo | -18.02% |
3-mo | -8.93% |
6-mo | 6.78% |
1-year | -3.15% |
3-year | 143.68% |
5-year | 68.52% |
YTD | -8.93% |
2022 | -8.46% |
2021 | 61.95% |
2020 | 19.00% |
2019 | 35.18% |
2018 | -33.15% |
JEF Dividends
Ex-Dividend Date | Type | Payout Amount | Change | ||||||
---|---|---|---|---|---|---|---|---|---|
Loading, please wait... |
Loading social stream, please wait...