J. Jill, Inc. (JILL): Price and Financial Metrics

J. Jill, Inc. (JILL): $31.97

1.14 (+3.70%)

POWR Rating

Component Grades

Momentum

C

Stability

C

Sentiment

Quality

A

Add JILL to Watchlist
Sign Up

Industry: Fashion & Luxury

Industry

B

Ranked

#1 of 61

in industry

JILL Price/Volume Stats

Current price $31.97 52-week high $32.96
Prev. close $30.83 52-week low $18.85
Day low $31.07 Volume 327,004
Day high $32.96 Avg. volume 97,895
50-day MA $25.61 Dividend yield N/A
200-day MA $25.42 Market Cap 338.98M

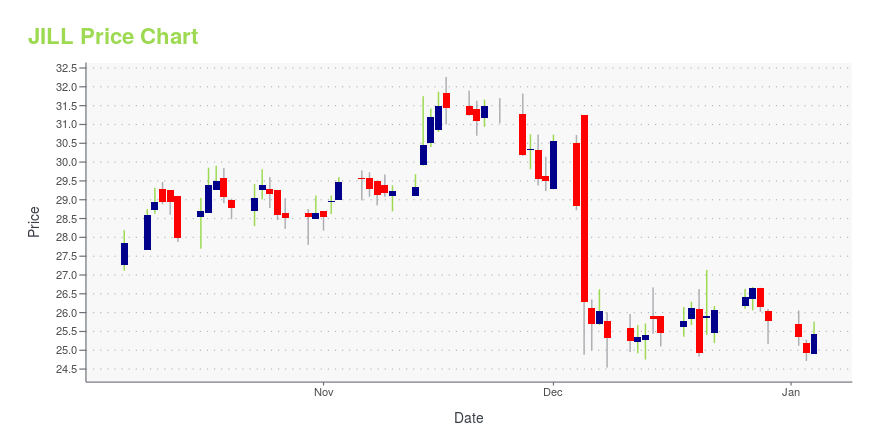
JILL Stock Price Chart Interactive Chart >

JILL POWR Grades

  • Quality is the dimension where JILL ranks best; there it ranks ahead of 99.53% of US stocks.
  • JILL's strongest trending metric is Quality; it's been moving up over the last 26 weeks.
  • JILL's current lowest rank is in the Growth metric (where it is better than 32.23% of US stocks).

JILL Stock Summary

  • JJILL INC's capital turnover -- a measure of revenue relative to shareholder's equity -- is better than 98.21% of US listed stocks.
  • Equity multiplier, or assets relative to shareholders' equity, comes in at 32.1 for JJILL INC; that's greater than it is for 98.73% of US stocks.
  • Shareholder yield, a measure of how much is returned to shareholders via dividends and share repurchases, for JILL comes in at 25.45% -- higher than that of 93.07% of stocks in our set.
  • Stocks with similar financial metrics, market capitalization, and price volatility to JJILL INC are SPI, BLBD, WMG, HBI, and PFG.
  • Visit JILL's SEC page to see the company's official filings. To visit the company's web site, go to www.jjill.com.

JILL Valuation Summary

  • JILL's price/sales ratio is 0.5; this is 75% lower than that of the median Consumer Cyclical stock.
  • Over the past 83 months, JILL's price/sales ratio has gone down 0.4.

Below are key valuation metrics over time for JILL.

Stock Date P/S P/B P/E EV/EBIT
JILL 2023-12-29 0.5 8.6 8.4 7.2
JILL 2023-12-28 0.5 8.8 8.5 7.3
JILL 2023-12-27 0.5 8.9 8.7 7.4
JILL 2023-12-26 0.5 8.8 8.6 7.3
JILL 2023-12-22 0.5 8.7 8.5 7.3
JILL 2023-12-21 0.5 8.7 8.5 7.3

JILL Growth Metrics

    The 2 year net income to common stockholders growth rate now stands at 102.25%.
  • The year over year net income to common stockholders growth rate now stands at 105.24%.
  • Its 3 year net income to common stockholders growth rate is now at -80.62%.
Over the past 18 months, JILL's revenue has gone up $147,922,000.

The table below shows JILL's growth in key financial areas (numbers in millions of US dollars).

Date Revenue Operating Cash Flow Net Income to Common Stock
2022-09-30 612.769 88.296 44.714
2022-06-30 614.296 82.594 47.033
2022-03-31 613.189 86.3 4.58
2021-12-31 585.206 74.999 -28.143
2021-09-30 565.954 38.976 -58.66
2021-06-30 531.447 10.391 -93.057

JILL's Quality Factors

The “Quality” component of the POWR Ratings focuses on 31 different factors of a companies fundamentals and operational strength. Here are some key insights as we drill into the specifics of these quality attributes.
  • JILL has a Quality Grade of B, ranking ahead of 80.1% of graded US stocks.
  • JILL's asset turnover comes in at 1.066 -- ranking 13th of 32 Apparel stocks.
  • OXM, SKX, and UAA are the stocks whose asset turnover ratios are most correlated with JILL.

The table below shows JILL's key quality metrics over time.

Period Asset Turnover Gross Margin ROIC
2021-07-31 1.066 0.635 -0.133
2021-05-01 0.886 0.609 -0.152
2021-01-30 0.766 0.576 -0.299
2020-10-31 0.793 0.585 -0.292
2020-08-01 0.821 0.603 -0.221
2020-05-02 0.917 0.598 -0.298

J. Jill, Inc. (JILL) Company Bio


J. Jill, LLC owns and operates women clothing stores. J. Jill, LLC was formerly known as The Birch Pond Group, Inc and changed its name to J. Jill, LLC in July, 2003. The company was founded in 2000 and is based in Quincy, Massachusetts.


JILL Latest News Stream


Event/Time News Detail
Loading, please wait...

JILL Latest Social Stream


Loading social stream, please wait...

View Full JILL Social Stream

Latest JILL News From Around the Web

Below are the latest news stories about JJILL INC that investors may wish to consider to help them evaluate JILL as an investment opportunity.

J.Jill, Inc.'s (NYSE:JILL) Earnings Are Not Doing Enough For Some Investors

When close to half the companies in the United States have price-to-earnings ratios (or "P/E's") above 17x, you may...

Yahoo | December 18, 2023

3 Stocks to Buy That Are Up 200% or More in 2023

With approximately 24 U.S.-listed stocks up 200% or more in 2023, three stand out as stocks to buy for 2024 and beyond.

Will Ashworth on InvestorPlace | December 17, 2023

J.Jill, Inc. (NYSE:JILL) Q3 2023 Earnings Call Transcript

J.Jill, Inc. (NYSE:JILL) Q3 2023 Earnings Call Transcript December 5, 2023 J.Jill, Inc. beats earnings expectations. Reported EPS is $0.78, expectations were $0.62. Operator: Good morning. My name is Christa, and I will be your conference operator today. At this time, I would like to welcome everyone to the J.Jill Third Quarter 2023 Earnings Conference […]

Yahoo | December 6, 2023

Q3 2023 JJill Inc Earnings Call

Q3 2023 JJill Inc Earnings Call

Yahoo | December 6, 2023

J.Jill Inc (JILL) Reports Marginal Decline in Net Sales with Improved Profitability in Q3 2023

Key Financial Highlights from J.Jill Inc's Latest Earnings Release

Yahoo | December 5, 2023

Read More 'JILL' Stories Here

JILL Price Returns

1-mo 26.56%
3-mo 24.01%
6-mo 8.01%
1-year 27.88%
3-year 278.79%
5-year 16.47%
YTD 24.01%
2023 3.95%
2022 29.30%
2021 414.21%
2020 -33.98%
2019 -78.80%

Get Free Updates

Join thousands of investors who get the latest news, insights and top rated picks from StockNews.com!