
St. Joe Company (The) (JOE): Price and Financial Metrics
JOE Price/Volume Stats
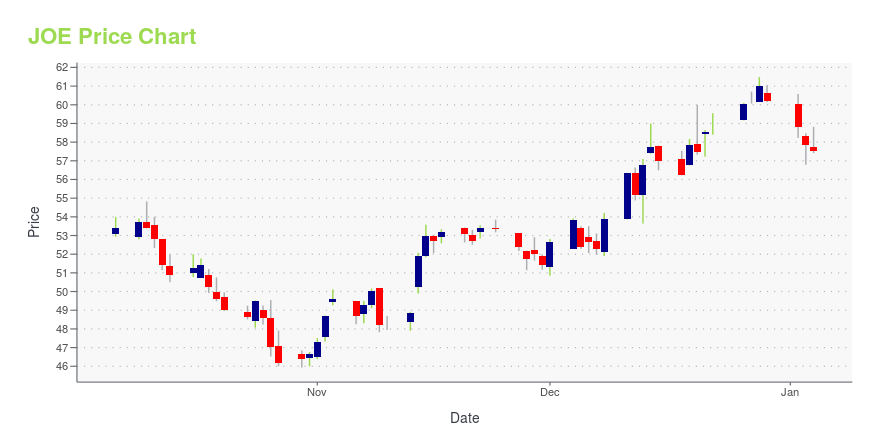
| Current price | $63.70 | 52-week high | $65.99 |
| Prev. close | $63.60 | 52-week low | $45.93 |
| Day low | $62.97 | Volume | 235,100 |
| Day high | $64.69 | Avg. volume | 179,179 |
| 50-day MA | $56.42 | Dividend yield | 0.77% |
| 200-day MA | $55.08 | Market Cap | 3.72B |
JOE Stock Price Chart Interactive Chart >
St. Joe Company (The) (JOE) Company Bio
The St. Joe Company operates as a real estate development company in Florida. The company operates in four segments: Residential Real Estate; Commercial Real Estate; Resorts, Leisure and Leasing Operations; and Forestry. The company was founded in 1936 and is based in WaterSound, Florida.
Latest JOE News From Around the Web
Below are the latest news stories about ST JOE CO that investors may wish to consider to help them evaluate JOE as an investment opportunity.
The St. Joe Company Announces a Barnes & Noble Bookstore Coming to Pier Park North®PANAMA CITY BEACH, Fla., December 14, 2023--THE ST. JOE COMPANY ANNOUNCES A BARNES & NOBLE BOOKSTORE COMING TO PIER PARK NORTH® |
Are Strong Financial Prospects The Force That Is Driving The Momentum In The St. Joe Company's NYSE:JOE) Stock?Most readers would already be aware that St. Joe's (NYSE:JOE) stock increased significantly by 16% over the past month... |
The St. Joe Company Announces Starbucks Among New Tenants Coming to Watersound® Town CenterPANAMA CITY BEACH, Fla., December 11, 2023--The St. Joe Company (NYSE: JOE) ("St. Joe") announces plans for a new Starbucks as well as additional retail, dining, medical and office tenants coming to Watersound Town Center, St. Joe’s open-air lifestyle center at the entrance to the Watersound Origins® community in Inlet Beach, Florida. |
The St. Joe Company Announces a New Watersound Club® Golf CoursePANAMA CITY BEACH, Fla., November 30, 2023--The St. Joe Company Announces a New Watersound Club Golf Course |
Those who invested in St. Joe (NYSE:JOE) five years ago are up 257%While The St. Joe Company ( NYSE:JOE ) shareholders are probably generally happy, the stock hasn't had particularly... |
JOE Price Returns
| 1-mo | 18.53% |
| 3-mo | 9.06% |
| 6-mo | 12.85% |
| 1-year | -0.40% |
| 3-year | 45.39% |
| 5-year | 245.79% |
| YTD | 6.31% |
| 2023 | 57.12% |
| 2022 | -25.07% |
| 2021 | 23.45% |
| 2020 | 114.56% |
| 2019 | 50.57% |
JOE Dividends
| Ex-Dividend Date | Type | Payout Amount | Change | ||||||
|---|---|---|---|---|---|---|---|---|---|
| Loading, please wait... | |||||||||
Continue Researching JOE
Here are a few links from around the web to help you further your research on St Joe Co's stock as an investment opportunity:St Joe Co (JOE) Stock Price | Nasdaq
St Joe Co (JOE) Stock Quote, History and News - Yahoo Finance
St Joe Co (JOE) Stock Price and Basic Information | MarketWatch
Loading social stream, please wait...