
KBR, Inc. (KBR): Price and Financial Metrics
KBR Price/Volume Stats
| Current price | $65.77 | 52-week high | $69.37 |
| Prev. close | $66.63 | 52-week low | $49.37 |
| Day low | $65.74 | Volume | 1,383,400 |
| Day high | $67.27 | Avg. volume | 1,197,506 |
| 50-day MA | $64.97 | Dividend yield | 0.87% |
| 200-day MA | $59.55 | Market Cap | 8.83B |
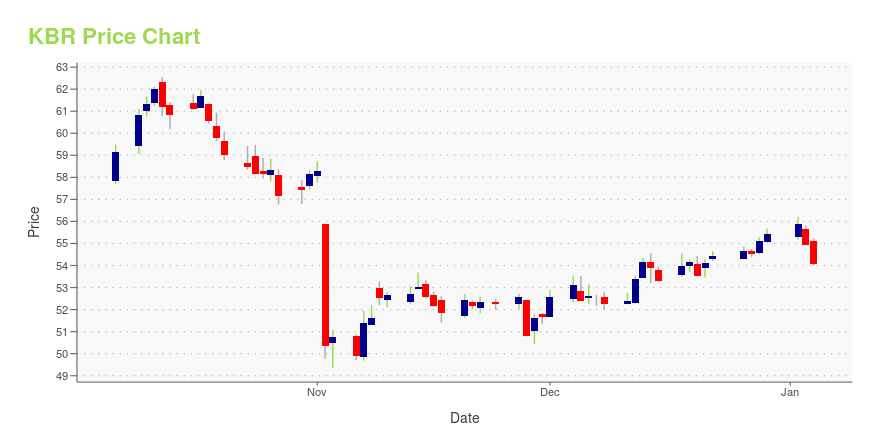
KBR Stock Price Chart Interactive Chart >
KBR, Inc. (KBR) Company Bio
KBR Inc. operates as an engineering, construction, and services company worldwide. The company operates through three segments: Technology & Consulting, Engineering & Construction, and Government Services. The company was founded in 1901 and is based in Houston, Texas.
Latest KBR News From Around the Web
Below are the latest news stories about KBR INC that investors may wish to consider to help them evaluate KBR as an investment opportunity.
KBR Teams with HJF, Awarded Critical Contract to Aid Military Neuroscience ResearchKBR (NYSE: KBR) is pleased to join forces with The Henry M. Jackson Foundation for the Advancement of Military Medicine (HJF) on an important contract to support neuroscience research for service members. This new award will specifically focus on those affected by traumatic brain injuries. Research will be done in collaboration with the Uniformed Services University (the nation's only federal health sciences university), and the University of California San Francisco (UCSF). |
It Might Not Be A Great Idea To Buy KBR, Inc. (NYSE:KBR) For Its Next DividendSome investors rely on dividends for growing their wealth, and if you're one of those dividend sleuths, you might be... |
Investor Favorites: 7 Dividend Stocks with Strong Buy RatingsIf you’re looking for the most confidence-inspiring ideas ahead of market ambiguities, don't overlook strong-buy dividend stocks. |
KBR (KBR) Up 2.6% Since Last Earnings Report: Can It Continue?KBR (KBR) reported earnings 30 days ago. What's next for the stock? We take a look at earnings estimates for some clues. |
PT Pupuk Sriwidjaja Selects KBR's Purifier Technology for Grassroots Ammonia Plant in IndonesiaKBR (NYSE: KBR) announced today that its Purifier™ ammonia technology has been selected by PT Pupuk Sriwidjaja Palembang (Pusri), a subsidiary of PT Pupuk Indonesia, for its planned Pusri 3B Ammonia Plant to be built in South Sumatera Province, Indonesia. This will be KBR's twelfth ammonia plant licensed to Pupuk Indonesia. |
KBR Price Returns
| 1-mo | 3.09% |
| 3-mo | 0.96% |
| 6-mo | 25.81% |
| 1-year | 7.61% |
| 3-year | 73.23% |
| 5-year | 164.93% |
| YTD | 19.27% |
| 2023 | 5.94% |
| 2022 | 11.93% |
| 2021 | 55.64% |
| 2020 | 3.23% |
| 2019 | 103.61% |
KBR Dividends
| Ex-Dividend Date | Type | Payout Amount | Change | ||||||
|---|---|---|---|---|---|---|---|---|---|
| Loading, please wait... | |||||||||
Continue Researching KBR
Want to do more research on Kbr Inc's stock and its price? Try the links below:Kbr Inc (KBR) Stock Price | Nasdaq
Kbr Inc (KBR) Stock Quote, History and News - Yahoo Finance
Kbr Inc (KBR) Stock Price and Basic Information | MarketWatch
Loading social stream, please wait...