Kelso Technologies Inc Ordinary Shares (KIQ): Price and Financial Metrics

Kelso Technologies Inc Ordinary Shares (KIQ): $0.21

0.01 (+5.05%)

POWR Rating

Component Grades

Momentum

C

Stability

D

Sentiment

Quality

D

Add KIQ to Watchlist
Sign Up

Industry: Railroads

Industry

NR

Ranked

#17 of 17

in industry

KIQ Price/Volume Stats

Current price $0.21 52-week high $0.44
Prev. close $0.20 52-week low $0.19
Day low $0.20 Volume 10,900
Day high $0.21 Avg. volume 93,812
50-day MA $0.27 Dividend yield N/A
200-day MA $0.28 Market Cap 11.41M

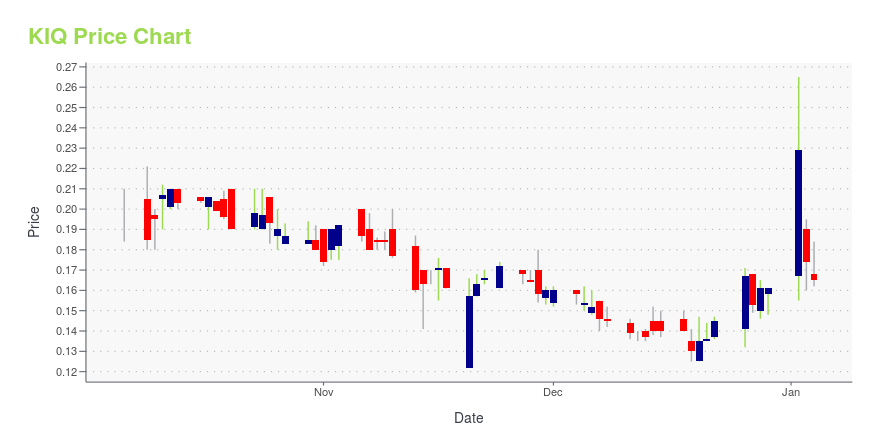
KIQ Stock Price Chart Interactive Chart >

KIQ Stock Summary

  • KELSO TECHNOLOGIES INC's market capitalization of $20,098,432 is ahead of only 8.66% of US-listed equities.
  • For KIQ, its debt to operating expenses ratio is greater than that reported by just 6.27% of US equities we're observing.
  • With a year-over-year growth in debt of -44.14%, KELSO TECHNOLOGIES INC's debt growth rate surpasses just 6.77% of about US stocks.
  • Stocks with similar financial metrics, market capitalization, and price volatility to KELSO TECHNOLOGIES INC are EHTH, SCOR, GNSS, JMIA, and UEIC.
  • KIQ's SEC filings can be seen here. And to visit KELSO TECHNOLOGIES INC's official web site, go to www.kelsotech.com.

KIQ Valuation Summary

  • KIQ's price/earnings ratio is -7.3; this is 137.06% lower than that of the median Industrials stock.
  • Over the past 120 months, KIQ's price/sales ratio has gone down 5.9.

Below are key valuation metrics over time for KIQ.

Stock Date P/S P/B P/E EV/EBIT
KIQ 2023-07-27 1.5 1.5 -7.3 -6.6
KIQ 2023-07-26 1.5 1.6 -7.4 -6.8
KIQ 2023-07-25 1.9 1.9 -9.2 -8.7
KIQ 2023-07-24 1.9 2.0 -9.7 -9.3
KIQ 2023-07-21 1.8 1.9 -9.1 -8.5
KIQ 2023-07-20 1.9 1.9 -9.2 -8.7

KIQ Growth Metrics

  • Its 2 year net cashflow from operations growth rate is now at -229.3%.
  • Its year over year cash and equivalents growth rate is now at -76.26%.
  • The 5 year cash and equivalents growth rate now stands at -66.96%.
KIQ's revenue has moved down $1,567,466 over the prior 24 months.

The table below shows KIQ's growth in key financial areas (numbers in millions of US dollars).

Date Revenue Operating Cash Flow Net Income to Common Stock
2020-12-31 11.14913 -1.561701 -1.30789
2019-12-31 20.55068 3.619014 3.334043
2018-12-31 12.7166 1.207836 0.194453
2017-12-31 6.062778 -1.630353 -5.015911
2017-12-31 6.062778 -1.630353 -5.015911
2016-12-31 8.077143 -1.14299 -2.465592

KIQ's Quality Factors

The “Quality” component of the POWR Ratings focuses on 31 different factors of a companies fundamentals and operational strength. Here are some key insights as we drill into the specifics of these quality attributes.
  • KIQ has a Quality Grade of D, ranking ahead of 6.2% of graded US stocks.
  • KIQ's asset turnover comes in at 0.866 -- ranking 5th of 10 Shipbuilding Railroad Equipment stocks.
  • 500 - Internal server error

The table below shows KIQ's key quality metrics over time.

Period Asset Turnover Gross Margin ROIC
2020-12-31 0.866 0.430 -0.127
2019-12-31 1.736 0.466 0.512
2018-12-31 1.331 0.416 -0.009
2017-12-31 0.546 0.168 -0.662
2017-12-31 0.546 0.168 -0.662
2016-12-31 0.553 0.245 -0.349


KIQ Latest News Stream


Event/Time News Detail
Loading, please wait...

KIQ Latest Social Stream


Loading social stream, please wait...

View Full KIQ Social Stream

Latest KIQ News From Around the Web

Below are the latest news stories about KELSO TECHNOLOGIES INC that investors may wish to consider to help them evaluate KIQ as an investment opportunity.

Kelso Technologies Inc. Financial Results for the Six Months Ended June 30, 2023

VANCOUVER, British Columbia and BONHAM, Texas, Aug. 10, 2023 (GLOBE NEWSWIRE) -- Kelso Technologies Inc. (“Kelso” or the “Company”), (TSX: KLS), (NYSE American: KIQ) reports that it has released its unaudited consolidated interim financial statements and Management Discussion and Analysis for the six months ended June 30, 2023. The unaudited consolidated interim financial statements were prepared in accordance with International Financial Reporting Standards (“IFRS”) as issued by the Internation

Yahoo | August 10, 2023

Kelso Technologies Inc. Announces 2023 Annual General Meeting Results

VANCOUVER, British Columbia and BONHAM, Texas, June 02, 2023 (GLOBE NEWSWIRE) -- Kelso Technologies Inc. (“Kelso” or the “Company”), (TSX: KLS), (NYSE American: KIQ) is pleased to announce the detailed voting results from the Annual General Meeting held on June 1, 2023 (the “Meeting”). A total of 25,816,872 common shares of the 54,320,086 common shares outstanding at the record date were voted at the Meeting, representing 47.53% of the issued and outstanding common shares of the Company at the r

Yahoo | June 2, 2023

Kelso Technologies Inc. Financial Results for the Three Months Ended March 31, 2023

VANCOUVER, British Columbia and BONHAM, Texas, May 11, 2023 (GLOBE NEWSWIRE) -- Kelso Technologies Inc. (“Kelso” or the “Company”), (TSX: KLS), (NYSE American: KIQ) reports that it has released its unaudited consolidated interim financial statements and Management Discussion and Analysis for the three months ended March 31, 2023. The unaudited consolidated interim financial statements were prepared in accordance with International Financial Reporting Standards (“IFRS”) as issued by the Internati

Yahoo | May 11, 2023

Kelso Technologies Inc. Announces it has Received Final Arbitration Judgement

VANCOUVER, British Columbia and BONHAM, Texas, May 04, 2023 (GLOBE NEWSWIRE) -- Kelso Technologies Inc. (“Kelso” or the “Company”), (TSX: KLS), (NYSE American: KIQ) reports that it has received the final arbitration decision in the arbitration proceeding relating to a dispute with G&J Technologies Inc. et al (the “Claimants”) which has been ongoing since March 2021. The dispute was with respect to the termination of a Technology Development Agreement (TDA) dated November 10, 2016 between the Com

Yahoo | May 4, 2023

Kelso Technologies Full Year 2022 Earnings: US$0.025 loss per share (vs US$0.051 loss in FY 2021)

Kelso Technologies ( TSE:KLS ) Full Year 2022 Results Key Financial Results Revenue: US$10.9m (up 47% from FY 2021...

Yahoo | April 1, 2023

Read More 'KIQ' Stories Here

KIQ Price Returns

1-mo -17.61%
3-mo -16.00%
6-mo -25.00%
1-year -32.24%
3-year -60.82%
5-year -52.27%
YTD -30.00%
2022 -32.60%
2021 -18.33%
2020 -24.63%
2019 68.16%
2018 -17.31%

Continue Researching KIQ

Want to see what other sources are saying about Kelso Technologies Inc's financials and stock price? Try the links below:

Kelso Technologies Inc (KIQ) Stock Price | Nasdaq
Kelso Technologies Inc (KIQ) Stock Quote, History and News - Yahoo Finance
Kelso Technologies Inc (KIQ) Stock Price and Basic Information | MarketWatch

Get Free Updates

Join thousands of investors who get the latest news, insights and top rated picks from StockNews.com!