
Lee Enterprises, Incorporated (LEE): Price and Financial Metrics
LEE Price/Volume Stats
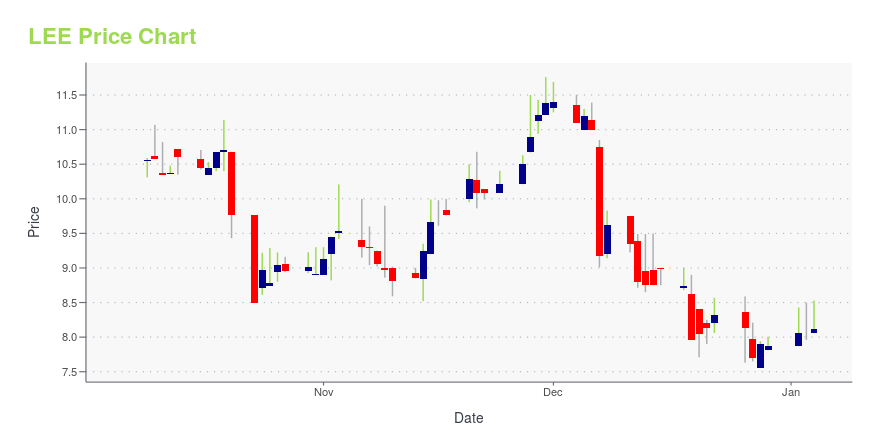
| Current price | $10.05 | 52-week high | $15.89 |
| Prev. close | $10.02 | 52-week low | $7.56 |
| Day low | $9.96 | Volume | 3,155 |
| Day high | $10.05 | Avg. volume | 27,339 |
| 50-day MA | $11.66 | Dividend yield | N/A |
| 200-day MA | $10.81 | Market Cap | 61.74M |
LEE Stock Price Chart Interactive Chart >
Lee Enterprises, Incorporated (LEE) Company Bio
Lee Enterprises, Incorporated provides local news and information, and advertising services primarily in the Midwest, Mountain West, and West regions of the United States. The company was founded in 1890 and is based in Davenport, Iowa.
Latest LEE News From Around the Web
Below are the latest news stories about LEE ENTERPRISES INC that investors may wish to consider to help them evaluate LEE as an investment opportunity.
Lee Enterprises Full Year 2023 Earnings: Misses ExpectationsLee Enterprises ( NASDAQ:LEE ) Full Year 2023 Results Key Financial Results Revenue: US$691.1m (down 12% from FY 2022... |
LEE Stock Earnings: Lee Enterprises Misses EPS, Misses Revenue for Q4 2023LEE stock results show that Lee Enterprises missed analyst estimates for earnings per share and missed on revenue for the fourth quarter of 2023. |
Lee Enterprises achieves all fiscal year guidance with strong fourth quarter results and increases long-term outlookTotal Digital Revenue(1) was $73M in the quarter, representing 44% of revenue Digital-only subscribers total 721,000, exceeding guidance and up 36% YOY Adjusted EBITDA(2) in line with full year guidance DAVENPORT, Iowa, Dec. 07, 2023 (GLOBE NEWSWIRE) -- Lee Enterprises, Incorporated (NASDAQ: LEE), a digital-first subscription platform providing high quality, trusted, local news, information and a major platform for advertising in 75 markets, today reported preliminary fourth quarter fiscal 2023 |
Ted Olt succeeds Dana Waterman in key Lee Enterprises roleTheodore F. Olt III Theodore F. Olt III C. Dana Waterman III C. Dana Waterman III DAVENPORT, Iowa, Dec. 06, 2023 (GLOBE NEWSWIRE) -- Theodore F. Olt III has been elected by the board of directors of Lee Enterprises, Incorporated (NASDAQ: LEE) to succeed C. Dana Waterman III, who is retiring after 34 years as secretary and general counsel. “Ted has worked closely with Dana on many key Lee projects for over two decades, so we know how valuable he will be to Lee in his new role,” said Mary Junck, c |
Lee Enterprises plans quarterly call and webcast December 7, 2023DAVENPORT, Iowa, Dec. 01, 2023 (GLOBE NEWSWIRE) -- Lee Enterprises, Incorporated (NASDAQ: LEE), a major subscription and advertising platform and a leading provider of high quality, trusted, local news and information in 75 markets, has scheduled an audio webcast and conference call for Thursday, December 7, 2023, at 9 a.m. Central Time. Lee plans to issue a news release before market opens that day with preliminary results for its year ended September 24, 2023. A live webcast of the conference |
LEE Price Returns
| 1-mo | -16.25% |
| 3-mo | -21.11% |
| 6-mo | -7.46% |
| 1-year | -31.02% |
| 3-year | -63.21% |
| 5-year | -51.21% |
| YTD | 27.70% |
| 2023 | -57.60% |
| 2022 | -46.27% |
| 2021 | 174.13% |
| 2020 | -11.27% |
| 2019 | -32.70% |
Continue Researching LEE
Here are a few links from around the web to help you further your research on LEE ENTERPRISES Inc's stock as an investment opportunity:LEE ENTERPRISES Inc (LEE) Stock Price | Nasdaq
LEE ENTERPRISES Inc (LEE) Stock Quote, History and News - Yahoo Finance
LEE ENTERPRISES Inc (LEE) Stock Price and Basic Information | MarketWatch
Loading social stream, please wait...