Lindblad Expeditions Holdings Inc. (LIND): Price and Financial Metrics
GET POWR RATINGS... FREE!
LIND POWR Grades
- Momentum is the dimension where LIND ranks best; there it ranks ahead of 48.57% of US stocks.
- The strongest trend for LIND is in Momentum, which has been heading down over the past 179 days.
- LIND ranks lowest in Sentiment; there it ranks in the 1st percentile.
LIND Stock Summary
- The capital turnover (annual revenue relative to shareholder's equity) for LIND is -1.87 -- better than merely 3.43% of US stocks.
- Equity multiplier, or assets relative to shareholders' equity, comes in at -19.58 for Lindblad Expeditions Holdings Inc; that's greater than it is for only 1.23% of US stocks.
- Revenue growth over the past 12 months for Lindblad Expeditions Holdings Inc comes in at 78.62%, a number that bests 89.44% of the US stocks we're tracking.
- If you're looking for stocks that are quantitatively similar to Lindblad Expeditions Holdings Inc, a group of peers worth examining would be LAUR, ELVT, CELP, HGV, and VAC.
- LIND's SEC filings can be seen here. And to visit Lindblad Expeditions Holdings Inc's official web site, go to www.expeditions.com.
LIND Valuation Summary
- LIND's EV/EBIT ratio is -9; this is 142.06% lower than that of the median Industrials stock.
- Over the past 99 months, LIND's price/sales ratio has gone NA NA.
- LIND's price/earnings ratio has moved up 47894.3 over the prior 99 months.
Below are key valuation metrics over time for LIND.
Stock | Date | P/S | P/B | P/E | EV/EBIT |
---|---|---|---|---|---|
LIND | 2021-08-26 | 40.0 | -22.4 | -5.7 | -9.0 |
LIND | 2021-08-25 | 41.3 | -23.1 | -5.9 | -9.2 |
LIND | 2021-08-24 | 40.7 | -22.8 | -5.8 | -9.1 |
LIND | 2021-08-23 | 39.0 | -21.9 | -5.5 | -8.9 |
LIND | 2021-08-20 | 36.6 | -20.5 | -5.2 | -8.5 |
LIND | 2021-08-19 | 35.7 | -20.0 | -5.1 | -8.3 |
LIND Growth Metrics
- The year over year price growth rate now stands at 175%.
- The 4 year price growth rate now stands at -40.99%.
- The year over year net income to common stockholders growth rate now stands at -4475.34%.

The table below shows LIND's growth in key financial areas (numbers in millions of US dollars).
Date | Revenue | Operating Cash Flow | Net Income to Common Stock |
---|---|---|---|
2021-12-31 | 147.107 | 32.495 | -124.665 |
2021-09-30 | 81.918 | 1.002 | -128.308 |
2021-06-30 | 18.43 | -33.657 | -130.009 |
2021-03-31 | 2.896 | -114.609 | -133.051 |
2020-12-31 | 82.356 | -92.257 | -100.442 |
2020-09-30 | 157.786 | -50.706 | -70.44 |
LIND's Quality Factors
The “Quality” component of the POWR Ratings focuses on 31 different factors of a companies fundamentals and operational strength. Here are some key insights as we drill into the specifics of these quality attributes.- LIND has a Quality Grade of D, ranking ahead of 22.89% of graded US stocks.
- LIND's asset turnover comes in at 0.104 -- ranking 129th of 137 Transportation stocks.
- RCL, UAL, and LUV are the stocks whose asset turnover ratios are most correlated with LIND.
The table below shows LIND's key quality metrics over time.
Period | Asset Turnover | Gross Margin | ROIC |
---|---|---|---|
2021-09-30 | 0.104 | -0.016 | -0.124 |
2021-06-30 | 0.024 | -1.479 | -0.140 |
2021-03-31 | 0.004 | -12.473 | -0.150 |
2020-12-31 | 0.116 | 0.114 | -0.118 |
2020-09-30 | 0.239 | 0.336 | -0.098 |
2020-06-30 | 0.420 | 0.438 | -0.047 |
LIND Price Target
For more insight on analysts targets of LIND, see our LIND price target page. And for a list of of all stocks sorted by upside potential based on analyst target price, see our Top Price Target page.
Average Price Target | $8.67 | Average Broker Recommendation | 1.38 (Strong Buy) |
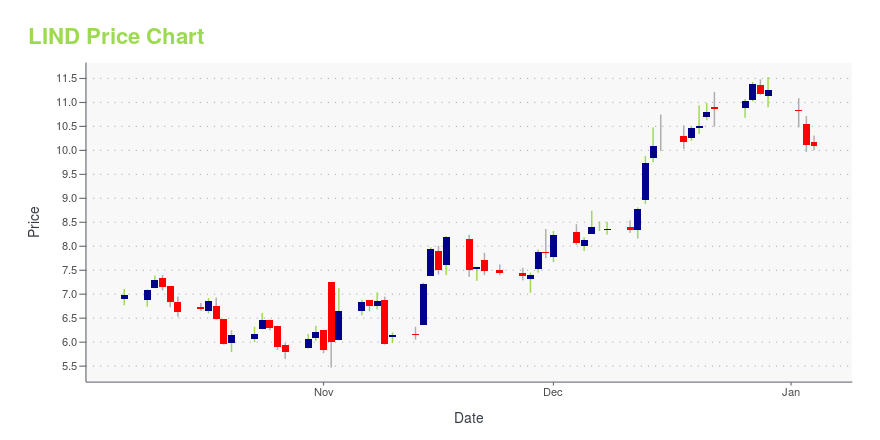
LIND Stock Price Chart Interactive Chart >
LIND Price/Volume Stats
Current price | $14.41 | 52-week high | $19.13 |
Prev. close | $13.19 | 52-week low | $10.16 |
Day low | $13.26 | Volume | 473,922 |
Day high | $14.43 | Avg. volume | 261,722 |
50-day MA | $14.15 | Dividend yield | N/A |
200-day MA | $15.24 | Market Cap | 734.07M |
Lindblad Expeditions Holdings Inc. (LIND) Company Bio
Lindblad Expeditions Holdings, Inc. provides expedition cruising and adventure travel services. The company provides itineraries that feature up-close encounters with wildlife and nature. The company has a strategic alliance with The National Geographic Society. The company is based in New York City, New York.
Latest LIND News From Around the Web
Below are the latest news stories about Lindblad Expeditions Holdings Inc that investors may wish to consider to help them evaluate LIND as an investment opportunity.
Lindblad Expeditions Holdings, Inc. (LIND) CEO Dolf Berle on Q4 2021 Results - Earnings Call TranscriptLindblad Expeditions Holdings, Inc. (LIND) Q4 2021 Earnings Conference Call February 22, 2022, 08:30 AM ET Company Participants Craig Felenstein - Chief Financial Officer Dolf Berle - Chief Executive Officer Conference Call Participants Steven Wieczynski - Stifel Alex Fuhrman - Craig-Hallum Capital Group Chris Woronka - Deutsche Bank Tyler Batory... |
LINDBLAD EXPEDITIONS HLDGS INC (LIND) Q4 2021 Earnings Call TranscriptGood morning, everyone, and welcome to the Lindblad Expeditions Inc. reports fourth quarter 2021 financial results conference call [Operator instructions] Today's event is being recorded. At this time, I'd like to turn the conference call over to Craig Felenstein. With me on the call today is Dolf Berle, Lindblad's chief executive officer. |
Lindblad Expeditions (LIND) Reports Q4 Loss, Tops Revenue EstimatesLindblad Expeditions (LIND) delivered earnings and revenue surprises of -10.20% and 7.19%, respectively, for the quarter ended December 2021. Do the numbers hold clues to what lies ahead for the stock? |
Lindblad Expeditions Holdings, Inc. Reports 2021 Fourth Quarter and Full Year Financial ResultsLindblad Expeditions Holdings, Inc. (NASDAQ: LIND; the "Company" or "Lindblad"), a global provider of expedition cruises and adventure travel experiences, today reported financial results for the fourth quarter and year ended December 31, 2021. |
Lindblad Expeditions Holdings, Inc. (NASDAQ:LIND) Shares Could Be 44% Below Their Intrinsic Value EstimateDoes the February share price for Lindblad Expeditions Holdings, Inc. ( NASDAQ:LIND ) reflect what it's really worth... |
LIND Price Returns
1-mo | -5.76% |
3-mo | -18.03% |
6-mo | -4.19% |
1-year | -18.77% |
3-year | -12.56% |
5-year | 54.45% |
YTD | -7.63% |
2021 | -8.88% |
2020 | 4.71% |
2019 | 21.47% |
2018 | 37.49% |
2017 | 3.60% |
Continue Researching LIND
Here are a few links from around the web to help you further your research on Lindblad Expeditions Holdings Inc's stock as an investment opportunity:Lindblad Expeditions Holdings Inc (LIND) Stock Price | Nasdaq
Lindblad Expeditions Holdings Inc (LIND) Stock Quote, History and News - Yahoo Finance
Lindblad Expeditions Holdings Inc (LIND) Stock Price and Basic Information | MarketWatch
Loading social stream, please wait...