
Live Ventures Incorporated (LIVE): Price and Financial Metrics
LIVE Price/Volume Stats
| Current price | $19.10 | 52-week high | $29.90 |
| Prev. close | $19.20 | 52-week low | $17.30 |
| Day low | $18.79 | Volume | 3,321 |
| Day high | $19.40 | Avg. volume | 7,112 |
| 50-day MA | $23.07 | Dividend yield | N/A |
| 200-day MA | $25.38 | Market Cap | 60.05M |
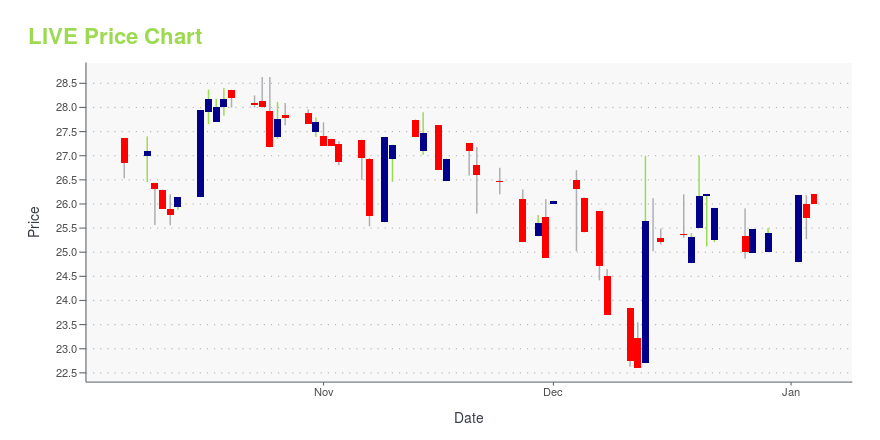
LIVE Stock Price Chart Interactive Chart >
Live Ventures Incorporated (LIVE) Company Bio
Live Ventures Incorporated, a holding company, engages in the acquisition of companies in various industries in the United States. The company operates through three segments: Manufacturing, Marketplace Platform, and Services. The company was founded in 1968 and is based in Las Vegas, Nevada.
Latest LIVE News From Around the Web
Below are the latest news stories about LIVE VENTURES INC that investors may wish to consider to help them evaluate LIVE as an investment opportunity.
Live Ventures Incorporated (NASDAQ:LIVE) Q4 2023 Earnings Call TranscriptLive Ventures Incorporated (NASDAQ:LIVE) Q4 2023 Earnings Call Transcript December 20, 2023 Live Ventures Incorporated misses on earnings expectations. Reported EPS is $-1.46 EPS, expectations were $1.43. LIVE isn’t one of the 30 most popular stocks among hedge funds at the end of the third quarter (see the details here). Operator: Good day, everyone and […] |
Live Ventures Incorporated (LIVE) Q4 2023 Earnings Call TranscriptLive Ventures Incorporated (LIVE) Q4 2023 Earnings Conference Call December 20, 2023 5:00 PM ET Company Participants Greg Powell - Director, Investor Relations Jon Isaac - Chief Executive Officer and President David Verret - Chief Financial Officer Eric Althofer - Chief Operating Officer Conference Call Participants Theodore O’Neill - Litchfield Hills Research Presentation Operator Good day, everyone and welcome to today’s Live Ventures Incorporated Earnings Call. [Operator Instructions] Please note, this call is being recorded, and that I will be standing by should you need any assistance. It is now my pleasure to turn today’s program over to Gr... |
LIVE Stock Earnings: Live Ventures Beats Revenue for Q4 2023LIVE stock results show that Live Ventures beat on revenue for the fourth quarter of 2023. |
Live Ventures Reports Fiscal Year 2023 Financial ResultsLAS VEGAS, Dec. 20, 2023 (GLOBE NEWSWIRE) -- Live Ventures Incorporated (Nasdaq: LIVE) (“Live Ventures” or the “Company”), a diversified holding company, today announced financial results for its fiscal year ended September 30, 2023. Fiscal Year 2023 Key Highlights: Acquired Flooring Liquidators, Inc. (“Flooring Liquidators”), Precision Metal Works, Inc. (“PMW”), certain assets from Cal Coast Carpet Warehouse, Inc., and the Harris Flooring Group® brands, transactions valued at approximately $117 |
Live Ventures Announces New Date for Fiscal Full Year 2023 Financial Results and Earnings Conference CallLAS VEGAS, Dec. 13, 2023 (GLOBE NEWSWIRE) -- Live Ventures Incorporated (NASDAQ: LIVE) (“Live Ventures” or the “Company”), a diversified holding company, today announced a new date for its earnings release for its fiscal full year ended September 30, 2023 to Wednesday, December 20, 2023, prior to market open. The Company will host its conference call on Wednesday, December 20, 2023 at 2:00 p.m. Pacific time (5:00 p.m. Eastern time) to discuss the results. The dial-in numbers are as follows: 800. |
LIVE Price Returns
| 1-mo | -20.35% |
| 3-mo | -26.17% |
| 6-mo | -26.45% |
| 1-year | -27.38% |
| 3-year | -70.15% |
| 5-year | 189.39% |
| YTD | -24.80% |
| 2023 | -18.85% |
| 2022 | -0.73% |
| 2021 | 153.86% |
| 2020 | 65.38% |
| 2019 | 11.76% |
Continue Researching LIVE
Here are a few links from around the web to help you further your research on LIVE VENTURES Inc's stock as an investment opportunity:LIVE VENTURES Inc (LIVE) Stock Price | Nasdaq
LIVE VENTURES Inc (LIVE) Stock Quote, History and News - Yahoo Finance
LIVE VENTURES Inc (LIVE) Stock Price and Basic Information | MarketWatch
Loading social stream, please wait...