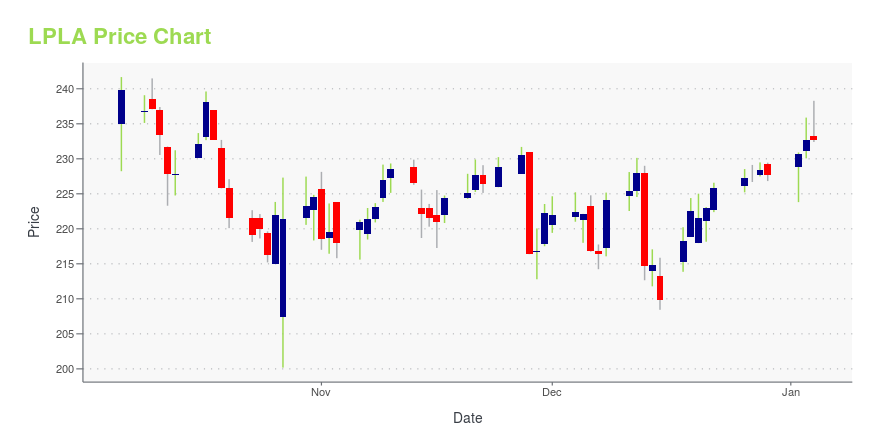
LPL Financial Holdings Inc. (LPLA): Price and Financial Metrics
GET POWR RATINGS... FREE!
LPLA POWR Grades
- LPLA scores best on the Momentum dimension, with a Momentum rank ahead of 72.46% of US stocks.
- LPLA's strongest trending metric is Stability; it's been moving down over the last 179 days.
- LPLA ranks lowest in Quality; there it ranks in the 24th percentile.
LPLA Stock Summary
- With a market capitalization of $14,837,518,951, LPL Financial Holdings Inc has a greater market value than 84.98% of US stocks.
- The capital turnover (annual revenue relative to shareholder's equity) for LPLA is 4.62 -- better than 91.14% of US stocks.
- Price to trailing twelve month operating cash flow for LPLA is currently 32.74, higher than 82.82% of US stocks with positive operating cash flow.
- Stocks with similar financial metrics, market capitalization, and price volatility to LPL Financial Holdings Inc are CACI, MOH, BKI, TTC, and CASY.
- Visit LPLA's SEC page to see the company's official filings. To visit the company's web site, go to www.lpl.com.
LPLA Valuation Summary
- LPLA's price/sales ratio is 1.7; this is 46.88% lower than that of the median Financial Services stock.
- LPLA's price/sales ratio has moved up 0.7 over the prior 131 months.
- Over the past 131 months, LPLA's price/earnings ratio has gone down 14.
Below are key valuation metrics over time for LPLA.
Stock | Date | P/S | P/B | P/E | EV/EBIT |
---|---|---|---|---|---|
LPLA | 2016-08-17 | 0.6 | 3.3 | 15.0 | 9.1 |
LPLA | 2015-12-24 | 0.9 | 4.3 | 21.2 | 12.9 |
LPLA | 2013-12-26 | 1.2 | 4.4 | 27.5 | 15.7 |
LPLA | 2013-06-19 | 1.1 | 3.3 | 24.0 | 13.6 |
LPLA | 2013-03-21 | 1.0 | 3.1 | 23.0 | 12.3 |
LPLA | 2011-08-29 | 0.9 | 2.4 | 751.1 | 39.2 |
LPLA Growth Metrics
- Its 4 year net cashflow from operations growth rate is now at 283.67%.
- Its year over year net cashflow from operations growth rate is now at -51.62%.
- Its 5 year cash and equivalents growth rate is now at 14.12%.

The table below shows LPLA's growth in key financial areas (numbers in millions of US dollars).
Date | Revenue | Operating Cash Flow | Net Income to Common Stock |
---|---|---|---|
2021-12-31 | 7,720.83 | 453.134 | 459.866 |
2021-09-30 | 7,207.921 | 525.944 | 463.333 |
2021-06-30 | 6,647.459 | 393.059 | 464.058 |
2021-03-31 | 6,115.86 | 469.175 | 446.619 |
2020-12-31 | 5,871.64 | 789.941 | 472.64 |
2020-09-30 | 5,738.252 | 577.769 | 487.768 |
LPLA's Quality Factors
The “Quality” component of the POWR Ratings focuses on 31 different factors of a companies fundamentals and operational strength. Here are some key insights as we drill into the specifics of these quality attributes.- LPLA has a Quality Grade of D, ranking ahead of 13.01% of graded US stocks.
- LPLA's asset turnover comes in at 1.033 -- ranking 14th of 444 Trading stocks.
- PSB, SELF, and SNEX are the stocks whose asset turnover ratios are most correlated with LPLA.
The table below shows LPLA's key quality metrics over time.
Period | Asset Turnover | Gross Margin | ROIC |
---|---|---|---|
2021-09-30 | 1.033 | 0.325 | 0.120 |
2021-06-30 | 1.005 | 0.334 | 0.126 |
2021-03-31 | 0.973 | 0.345 | 0.129 |
2020-12-31 | 0.954 | 0.358 | 0.140 |
2020-09-30 | 0.957 | 0.367 | 0.147 |
2020-06-30 | 0.963 | 0.377 | 0.159 |
LPLA Price Target
For more insight on analysts targets of LPLA, see our LPLA price target page. And for a list of of all stocks sorted by upside potential based on analyst target price, see our Top Price Target page.
Average Price Target | $188.88 | Average Broker Recommendation | 1.4 (Strong Buy) |
LPLA Stock Price Chart Interactive Chart >
LPLA Price/Volume Stats
Current price | $222.83 | 52-week high | $227.13 |
Prev. close | $225.14 | 52-week low | $137.59 |
Day low | $221.71 | Volume | 793,400 |
Day high | $225.99 | Avg. volume | 802,329 |
50-day MA | $192.63 | Dividend yield | 0.45% |
200-day MA | $179.16 | Market Cap | 17.78B |
LPL Financial Holdings Inc. (LPLA) Company Bio
LPL Financial Holdings provides an integrated platform of brokerage and investment advisory services to independent financial advisors and financial advisors at financial institutions in the United States. The company was established in 1989 and is based in Boston, Massachusetts.
Latest LPLA News From Around the Web
Below are the latest news stories about LPL Financial Holdings Inc that investors may wish to consider to help them evaluate LPLA as an investment opportunity.
Two LPL Financial Attorneys Join Leadership Council Aimed at Strengthening Diversity, Inclusion in Legal ProfessionCHARLOTTE, N.C., Feb. 24, 2022 (GLOBE NEWSWIRE) -- LPL Financial LLC announced today that LPL attorneys Ashley Horn and Roma Patel have been selected for the Leadership Council on Legal Diversity (LCLD) 2022 Fellows Program. Designed for lawyers with eight to 15 years of experience, the program connects high-potential attorneys with leading general counsel, managing partners and their peers for mentoring, career guidance and training. Since its inception in 2009, LCLD has helped to create a more |
Financial Advisor Mark Ross Joins Linsco by LPL FinancialCHARLOTTE, N.C., Feb. 22, 2022 (GLOBE NEWSWIRE) -- LPL Financial LLC (Nasdaq:LPLA) announced today that financial advisor John “Mark” Ross has joined LPL, affiliating with Linsco by LPL, the firm’s employee advisor model. He reported having served approximately $100 million in advisory, brokerage and retirement plan assets* and joins LPL from Wells Fargo Advisors. For more than two decades, Ross has helped clients build, manage, preserve and transition their wealth to future generations, taking |
LPL Financial: A Reasonably Priced Secular Growth StoryLPL Financial's (LPLA) results impressed yet again, highlighting its best-in-class organic growth and expense discipline while also benefiting from significant rate optionality. Over the medium to longer-term, the ongoing channel expansion and the addition of new services to support financial advisors should drive revenue growth higher as well, with a... |
LPL Financial (LPLA) January Metrics Down On Adverse MarketsThe decline in LPL Financial's (LPLA) total brokerage and advisory assets at the end of January 2022 is a result of unfavorable equity markets' return and decline in net new assets balance. |
LPL Financial reports 6% annualized growth in January total net new assetsLPL Financial (NASDAQ:LPLA) reported total net new assets of $6.1B for January 2022 which translated to a 6% annualized growth rate. Total advisory and brokerage assets stood at $1.16T (-$49B or 4% from December 2021 levels). Total net new advisory assets were $5.9B, translating to an 11.0% annualized growth rate.... |
LPLA Price Returns
1-mo | 22.54% |
3-mo | 29.29% |
6-mo | 17.95% |
1-year | 54.30% |
3-year | 205.31% |
5-year | 418.50% |
YTD | 39.58% |
2021 | 54.63% |
2020 | 14.58% |
2019 | 52.95% |
2018 | 8.53% |
2017 | 66.03% |
LPLA Dividends
Ex-Dividend Date | Type | Payout Amount | Change | ||||||
---|---|---|---|---|---|---|---|---|---|
Loading, please wait... |
Continue Researching LPLA
Here are a few links from around the web to help you further your research on LPL Financial Holdings Inc's stock as an investment opportunity:LPL Financial Holdings Inc (LPLA) Stock Price | Nasdaq
LPL Financial Holdings Inc (LPLA) Stock Quote, History and News - Yahoo Finance
LPL Financial Holdings Inc (LPLA) Stock Price and Basic Information | MarketWatch
Loading social stream, please wait...