Liquidity Services, Inc. (LQDT): Price and Financial Metrics
LQDT Price/Volume Stats
Current price | $17.35 | 52-week high | $18.87 |
Prev. close | $17.54 | 52-week low | $11.97 |
Day low | $17.26 | Volume | 97,011 |
Day high | $17.76 | Avg. volume | 146,661 |
50-day MA | $17.63 | Dividend yield | N/A |
200-day MA | $15.05 | Market Cap | 532.49M |
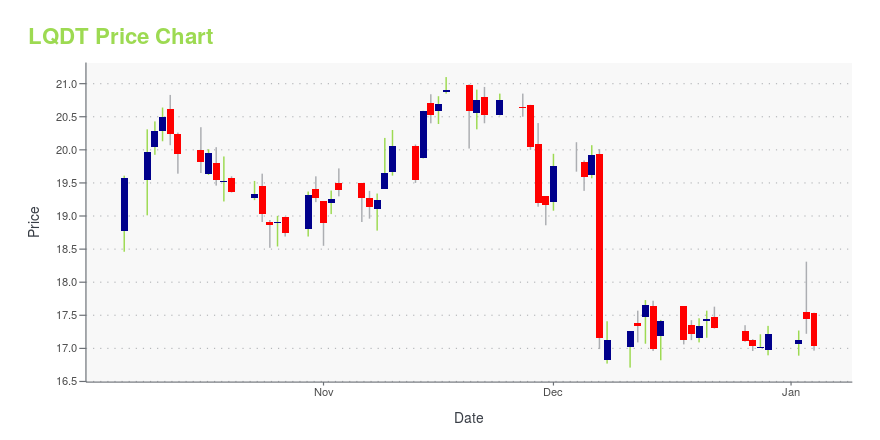
LQDT Stock Price Chart Interactive Chart >
LQDT POWR Grades
- LQDT scores best on the Quality dimension, with a Quality rank ahead of 98.33% of US stocks.
- The strongest trend for LQDT is in Quality, which has been heading up over the past 179 days.
- LQDT ranks lowest in Momentum; there it ranks in the 4th percentile.
LQDT Stock Summary
- LIQUIDITY SERVICES INC's capital turnover -- a measure of revenue relative to shareholder's equity -- is better than 71.64% of US listed stocks.
- For LQDT, its debt to operating expenses ratio is greater than that reported by merely 13.12% of US equities we're observing.
- With a year-over-year growth in debt of -28.15%, LIQUIDITY SERVICES INC's debt growth rate surpasses merely 11.35% of about US stocks.
- Stocks that are quantitatively similar to LQDT, based on their financial statements, market capitalization, and price volatility, are DAIO, ACLS, SPOK, AEIS, and KOPN.
- LQDT's SEC filings can be seen here. And to visit LIQUIDITY SERVICES INC's official web site, go to www.liquidityservices.com.
LQDT Valuation Summary
- In comparison to the median Consumer Cyclical stock, LQDT's price/sales ratio is 157.14% higher, now standing at 1.8.
- Over the past 214 months, LQDT's price/sales ratio has gone down 1.4.
Below are key valuation metrics over time for LQDT.
Stock | Date | P/S | P/B | P/E | EV/EBIT |
---|---|---|---|---|---|
LQDT | 2023-09-13 | 1.8 | 3.5 | 23.7 | 15.0 |
LQDT | 2023-09-12 | 1.8 | 3.5 | 23.9 | 15.1 |
LQDT | 2023-09-11 | 1.8 | 3.5 | 23.8 | 15.1 |
LQDT | 2023-09-08 | 1.7 | 3.3 | 22.4 | 14.0 |
LQDT | 2023-09-07 | 1.7 | 3.3 | 22.5 | 14.1 |
LQDT | 2023-09-06 | 1.7 | 3.4 | 22.9 | 14.4 |
LQDT Growth Metrics
- Its year over year net income to common stockholders growth rate is now at 267.68%.
- Its 5 year net income to common stockholders growth rate is now at 72.62%.
- The year over year revenue growth rate now stands at 24.34%.

The table below shows LQDT's growth in key financial areas (numbers in millions of US dollars).
Date | Revenue | Operating Cash Flow | Net Income to Common Stock |
---|---|---|---|
2022-12-31 | 285.625 | 32.303 | 40.69 |
2022-09-30 | 280.05 | 44.833 | 40.324 |
2022-06-30 | 275.175 | 42.283 | 64.736 |
2022-03-31 | 274.975 | 48.729 | 56.747 |
2021-12-31 | 268.486 | 61.25 | 50.037 |
2021-09-30 | 257.531 | 65.417 | 50.949 |
LQDT's Quality Factors
The “Quality” component of the POWR Ratings focuses on 31 different factors of a companies fundamentals and operational strength. Here are some key insights as we drill into the specifics of these quality attributes.- LQDT has a Quality Grade of A, ranking ahead of 99.12% of graded US stocks.
- LQDT's asset turnover comes in at 1.133 -- ranking 101st of 563 Business Services stocks.
- ZEN, ETSY, and PIRS are the stocks whose asset turnover ratios are most correlated with LQDT.
The table below shows LQDT's key quality metrics over time.
Period | Asset Turnover | Gross Margin | ROIC |
---|---|---|---|
2021-06-30 | 1.133 | 0.588 | -1.613 |
2021-03-31 | 1.081 | 0.574 | -1.864 |
2020-12-31 | 1.084 | 0.555 | 5.343 |
2020-09-30 | 1.089 | 0.534 | -0.237 |
2020-06-30 | 1.118 | 0.518 | -0.742 |
2020-03-31 | 1.180 | 0.525 | -0.706 |
LQDT Price Target
For more insight on analysts targets of LQDT, see our LQDT price target page. And for a list of of all stocks sorted by upside potential based on analyst target price, see our Top Price Target page.
Average Price Target | $32.50 | Average Broker Recommendation | 1 (Strong Buy) |
Liquidity Services, Inc. (LQDT) Company Bio
Liquidity Services operates online auction marketplaces for sellers and buyers of surplus, salvage, and scrap assets in the United States. The company was founded in 1999 and is based in Washington, District of Columbia.
Latest LQDT News From Around the Web
Below are the latest news stories about LIQUIDITY SERVICES INC that investors may wish to consider to help them evaluate LQDT as an investment opportunity.
AllSurplus to Conduct Online Auction of Unused Surplus Equipment from Oil Sands and Heavy Oil Operations for Leading Energy CompanyMore than 150 assets offered for sale through online global platformBETHESDA, Md., Sept. 15, 2023 (GLOBE NEWSWIRE) -- Liquidity Services (NASDAQ:LQDT), a leading global commerce company powering the circular economy, today announced the auction of energy surplus assets in the Alberta, Canada for a leading oil and gas industry partner. More than 150 unused energy assets are currently available until 6:00 pm EDT September 20, 2023 on AllSurplus.com, the largest online marketplace for surplus busin |
Pacific County, WA Treasurer’s Office’s First Virtual Tax Sale Opens on Bid4Assets.com to Huge Success26 of the 27 properties listed on Bid4Assets sold in a two-day online tax saleSOUTH BEND, Wash., Aug. 31, 2023 (GLOBE NEWSWIRE) -- The Pacific County, WA Treasurer’s office conducted the county’s first-ever virtual tax foreclosure sale with Bid4Assets, a leading online auction marketplace for distressed real estate sales. The sale ran from July 6 to July 7 and resulted in 26 of the 27 properties listed selling at auction, producing a total of $519,260 in sale proceeds. “Our office had not held a |
Are Robust Financials Driving The Recent Rally In Liquidity Services, Inc.'s (NASDAQ:LQDT) Stock?Liquidity Services (NASDAQ:LQDT) has had a great run on the share market with its stock up by a significant 20% over... |
GovDeals Achieves $4 Billion in SalesSales Growth Milestone Reinforces Position as Industry Leader in Public SectorMONTGOMERY, Ala., Aug. 14, 2023 (GLOBE NEWSWIRE) -- GovDeals, the leading online marketplace for government agencies, educational institutions, and related agencies to sell surplus assets, is thrilled to announce it has completed $4 Billion in cumulative auction sales. This remarkable achievement underscores the company’s unwavering commitment to sustainable business practices and transparent surplus sales. Since its i |
Q3 2023 Liquidity Services Inc Earnings CallQ3 2023 Liquidity Services Inc Earnings Call |
LQDT Price Returns
1-mo | -4.67% |
3-mo | 11.72% |
6-mo | 37.15% |
1-year | 7.36% |
3-year | 152.00% |
5-year | 179.84% |
YTD | 23.40% |
2022 | -36.32% |
2021 | 38.78% |
2020 | 166.95% |
2019 | -3.40% |
2018 | 27.22% |
Continue Researching LQDT
Want to do more research on Liquidity Services Inc's stock and its price? Try the links below:Liquidity Services Inc (LQDT) Stock Price | Nasdaq
Liquidity Services Inc (LQDT) Stock Quote, History and News - Yahoo Finance
Liquidity Services Inc (LQDT) Stock Price and Basic Information | MarketWatch
Loading social stream, please wait...