
Las Vegas Sands Corp. (LVS): Price and Financial Metrics
LVS Price/Volume Stats
| Current price | $39.18 | 52-week high | $60.47 |
| Prev. close | $39.34 | 52-week low | $38.92 |
| Day low | $38.92 | Volume | 6,490,700 |
| Day high | $39.79 | Avg. volume | 5,363,797 |
| 50-day MA | $43.56 | Dividend yield | 1.95% |
| 200-day MA | $47.88 | Market Cap | 29.19B |
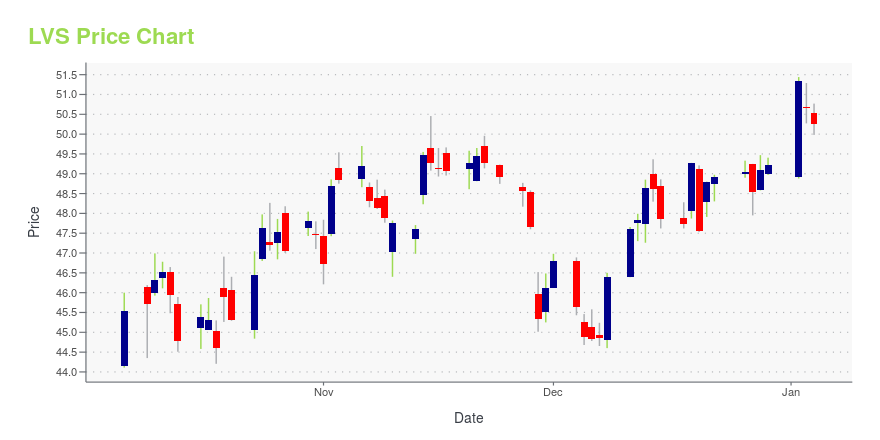
LVS Stock Price Chart Interactive Chart >
Las Vegas Sands Corp. (LVS) Company Bio
Las Vegas Sands Corporation is an American casino and resort company based in Paradise, Nevada, United States. The resorts feature accommodations such as gambling and entertainment, convention and exhibition facilities, restaurants and clubs, as well as an art and science museum in Singapore. (Source:Wikipedia)
Latest LVS News From Around the Web
Below are the latest news stories about LAS VEGAS SANDS CORP that investors may wish to consider to help them evaluate LVS as an investment opportunity.
The 3 Most Attractively Priced Growth Stocks to Buy Before JanuaryLeft-behind growth stocks offer compelling risk-reward profiles heading into 2024. |
S&P 500 Gains and Losses: An Update to the Model Y Sends Tesla Shares HigherU.S. equities made small gains, with the S&P 500 up 0.1%, as the market continued to be fueled by optimism about possible Federal Reserve rate cuts in 2024. |
Mark Cuban says the changing NBA landscape led to his sale of the Mavs to casino familiesMark Cuban sees a future of NBA ownership where the advantages will be in real estate. The high-profile billionaire says that's why he sold his majority stake in the Dallas Mavericks to a pair of families with strong ties to the hotel and casino industry. The NBA on Wednesday approved Cuban's sale of a controlling interest in the Mavericks to the Adelson and Dumont families, who run Las Vegas Sands Corp. |
HBCU Students Reflect on the Inaugural Sands Hospitality Immersion ProgramNORTHAMPTON, MA / ACCESSWIRE / December 19, 2023 / Las Vegas Sands Published by Las Vegas Sands on November 17, 2023 For Erin Williams, a junior at Howard University, the inaugural Sands Hospitality Immersion Program changed her career goals. "This ... |
Should You Think About Buying Las Vegas Sands Corp. (NYSE:LVS) Now?Let's talk about the popular Las Vegas Sands Corp. ( NYSE:LVS ). The company's shares saw significant share price... |
LVS Price Returns
| 1-mo | -10.57% |
| 3-mo | -13.43% |
| 6-mo | -21.04% |
| 1-year | -31.76% |
| 3-year | -8.75% |
| 5-year | -34.15% |
| YTD | -19.72% |
| 2023 | 3.15% |
| 2022 | 27.71% |
| 2021 | -36.85% |
| 2020 | -11.95% |
| 2019 | 39.54% |
LVS Dividends
| Ex-Dividend Date | Type | Payout Amount | Change | ||||||
|---|---|---|---|---|---|---|---|---|---|
| Loading, please wait... | |||||||||
Continue Researching LVS
Want to see what other sources are saying about Las Vegas Sands Corp's financials and stock price? Try the links below:Las Vegas Sands Corp (LVS) Stock Price | Nasdaq
Las Vegas Sands Corp (LVS) Stock Quote, History and News - Yahoo Finance
Las Vegas Sands Corp (LVS) Stock Price and Basic Information | MarketWatch
Loading social stream, please wait...