Macy's Inc (M): Price and Financial Metrics

Macy's Inc (M): $19.99

0.14 (+0.71%)

POWR Rating

Component Grades

Momentum

B

Stability

D

Sentiment

Quality

B

Industry: Fashion & Luxury

Industry

B

Ranked

#30 of 62

in industry

M Price/Volume Stats
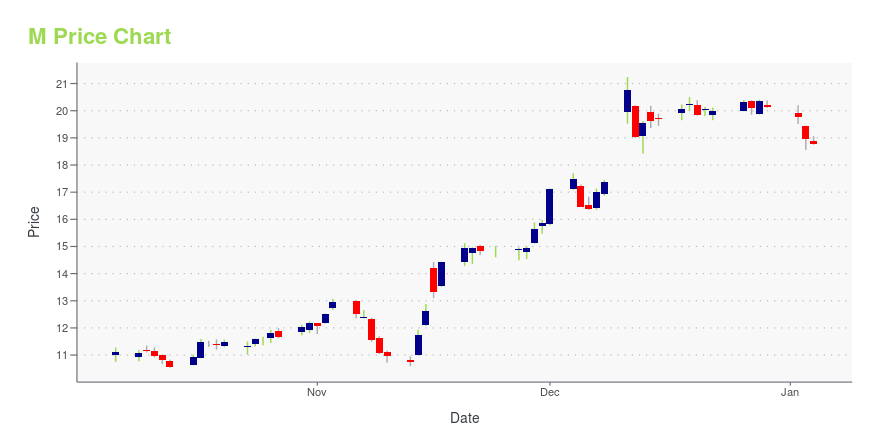
Current price $19.99 52-week high $22.10
Prev. close $19.85 52-week low $10.54
Day low $19.65 Volume 8,341,891
Day high $20.05 Avg. volume 8,466,054
50-day MA $19.44 Dividend yield 3.54%
200-day MA $15.88 Market Cap 5.48B

M Stock Price Chart Interactive Chart >

M POWR Grades

  • M scores best on the Value dimension, with a Value rank ahead of 97.75% of US stocks.
  • The strongest trend for M is in Growth, which has been heading up over the past 26 weeks.
  • M's current lowest rank is in the Stability metric (where it is better than 3.07% of US stocks).

M Stock Summary

  • The capital turnover (annual revenue relative to shareholder's equity) for M is 5.73 -- better than 92.23% of US stocks.
  • M's current price/earnings ratio is 7.58, which is higher than only 11.56% of US stocks with positive earnings.
  • With a price/sales ratio of 0.22, MACY'S INC has a higher such ratio than merely 6.13% of stocks in our set.
  • Stocks with similar financial metrics, market capitalization, and price volatility to MACY'S INC are CAL, SIG, RYI, AAP, and MAN.
  • Visit M's SEC page to see the company's official filings. To visit the company's web site, go to www.macysinc.com.

M Valuation Summary

  • M's EV/EBIT ratio is 11.2; this is 26.8% lower than that of the median Consumer Cyclical stock.
  • Over the past 243 months, M's price/sales ratio has gone down 0.4.

Below are key valuation metrics over time for M.

Stock Date P/S P/B P/E EV/EBIT
M 2023-12-29 0.2 1.3 8.1 11.2
M 2023-12-28 0.2 1.3 8.1 11.3
M 2023-12-27 0.2 1.3 8.0 11.2
M 2023-12-26 0.2 1.3 8.1 11.2
M 2023-12-22 0.2 1.3 8.0 11.2
M 2023-12-21 0.2 1.3 8.0 11.2

M Growth Metrics

    The 2 year net income to common stockholders growth rate now stands at 151.16%.
  • Its year over year net cashflow from operations growth rate is now at 88.68%.
  • The 3 year price growth rate now stands at 16.14%.
Over the past 49 months, M's revenue has gone down $3.39e+08.

The table below shows M's growth in key financial areas (numbers in millions of US dollars).

Date Revenue Operating Cash Flow Net Income to Common Stock
2022-09-30 24,844 2,359 1,412
2022-06-30 25,054 2,050 1,543
2022-03-31 25,101 2,466 1,613
2021-12-31 24,460 2,712 1,430
2021-09-30 22,573 1,246 847
2021-06-30 21,123 1,621 517

M's Quality Factors

The “Quality” component of the POWR Ratings focuses on 31 different factors of a companies fundamentals and operational strength. Here are some key insights as we drill into the specifics of these quality attributes.
  • M has a Quality Grade of B, ranking ahead of 92.25% of graded US stocks.
  • M's asset turnover comes in at 1.151 -- ranking 122nd of 165 Retail stocks.
  • CRMT, CATO, and JWN are the stocks whose asset turnover ratios are most correlated with M.

The table below shows M's key quality metrics over time.

Period Asset Turnover Gross Margin ROIC
2021-07-31 1.151 0.370 0.058
2021-05-01 1.049 0.334 -0.010
2021-01-30 0.949 0.292 -0.246
2020-10-31 0.987 0.309 -0.241
2020-08-01 1.005 0.323 -0.229
2020-05-02 1.063 0.354 -0.184

M Price Target

For more insight on analysts targets of M, see our M price target page. And for a list of of all stocks sorted by upside potential based on analyst target price, see our Top Price Target page.

Average Price Target $22.77 Average Broker Recommendation 2.03 (Hold)

Macy's Inc (M) Company Bio


Macy's sells a range of merchandise, including apparel and accessories for men, women, and children; cosmetics; home furnishings; and other consumer goods through its department stores and direct-to-consumer. The company was founded in 1830 and is based in Cincinnati, Ohio.


M Latest News Stream


Event/Time News Detail
Loading, please wait...

M Latest Social Stream


Loading social stream, please wait...

View Full M Social Stream

Latest M News From Around the Web

Below are the latest news stories about MACY'S INC that investors may wish to consider to help them evaluate M as an investment opportunity.

Rejoice that Santa Claus gives prime delivery to everyone

Macy’s is right to recognise that express lanes and priority fulfilment are not in the Christmas spirit

Yahoo | December 23, 2023

Not so 'Super' Saturday: Retailers dangle fewer discounts for inflation-weary shoppers

Last-minute shoppers looking for late deals ahead of Christmas may find smaller discounts and fewer items marked down at major retailers including Macy’s, Target and Ulta Beauty, according to an analyst and two datasets measuring retailers' recent prices. After ramping up promotions for Black Friday, some of the country’s top gifting destinations cut back both the number and size of their price markdowns on key products from Nov. 1 to Dec. 1, according to data from Centric Market Intelligence, formerly StyleSage, which analyzes retailers, brands, online trends and products across the globe. Data analytics firm Vertical Knowledge, which examines pricing and discounts across retailers’ websites, found retailers including Abercrombie & Fitch and Macy's-owned Bloomingdale’s also shrank or...

Yahoo | December 22, 2023

Why Is Kohl's (KSS) Up 17.4% Since Last Earnings Report?

Kohl's (KSS) reported earnings 30 days ago. What's next for the stock? We take a look at earnings estimates for some clues.

Yahoo | December 21, 2023

Boots on the Ground in the Mall: It's All About the Bags Shoppers Carry

The lead-up to the Christmas holiday led Chris Versace to go on one of his holiday shopping mall walks this weekend. Not to just any mall but to the Tyson's Corner Center, one of the top 10 malls in the US and the home of the very first Apple Store.

Yahoo | December 18, 2023

QuickLogic and Dorman Products have been highlighted as Zacks Bull and Bear of the Day

QuickLogic and Dorman Products have been highlighted as Zacks Bull and Bear of the Day.

Yahoo | December 18, 2023

Read More 'M' Stories Here

M Price Returns

1-mo 1.04%
3-mo 0.19%
6-mo 75.10%
1-year 20.39%
3-year 38.41%
5-year 1.42%
YTD 0.19%
2023 1.63%
2022 -18.67%
2021 135.80%
2020 -31.09%
2019 -38.21%

M Dividends

Ex-Dividend Date Type Payout Amount Change
Loading, please wait...
View Full M Dividend History

Continue Researching M

Here are a few links from around the web to help you further your research on Macy's Inc's stock as an investment opportunity:

Macy's Inc (M) Stock Price | Nasdaq
Macy's Inc (M) Stock Quote, History and News - Yahoo Finance
Macy's Inc (M) Stock Price and Basic Information | MarketWatch

Get Free Updates

Join thousands of investors who get the latest news, insights and top rated picks from StockNews.com!