WM Holding Company, LLC (MAPS): Price and Financial Metrics
GET POWR RATINGS... FREE!
MAPS POWR Grades
- Value is the dimension where MAPS ranks best; there it ranks ahead of 92.57% of US stocks.
- The strongest trend for MAPS is in Quality, which has been heading down over the past 178 days.
- MAPS's current lowest rank is in the Growth metric (where it is better than 0.37% of US stocks).
MAPS Stock Summary
- The capital turnover (annual revenue relative to shareholder's equity) for MAPS is 16.11 -- better than 97.89% of US stocks.
- MAPS's went public 3.62 years ago, making it older than only 17.46% of listed US stocks we're tracking.
- In terms of volatility of its share price, MAPS is more volatile than 94.02% of stocks we're observing.
- If you're looking for stocks that are quantitatively similar to WM TECHNOLOGY INC, a group of peers worth examining would be CAMP, CUTR, OWLT, WAT, and EGHT.
- MAPS's SEC filings can be seen here. And to visit WM TECHNOLOGY INC's official web site, go to silverspikecap.com.
MAPS Valuation Summary
- In comparison to the median Technology stock, MAPS's price/earnings ratio is 81.9% lower, now standing at 4.2.
- Over the past 44 months, MAPS's price/sales ratio has gone down 2.6.
Below are key valuation metrics over time for MAPS.
Stock | Date | P/S | P/B | P/E | EV/EBIT |
---|---|---|---|---|---|
MAPS | 2023-03-14 | 0.5 | 1.0 | 4.2 | 5.8 |
MAPS | 2023-03-13 | 0.6 | 1.1 | 4.5 | 6.2 |
MAPS | 2023-03-10 | 0.5 | 1.0 | 4.1 | 5.7 |
MAPS | 2023-03-09 | 0.6 | 1.1 | 4.6 | 6.3 |
MAPS | 2023-03-08 | 0.6 | 1.2 | 4.9 | 6.7 |
MAPS | 2023-03-07 | 0.7 | 1.3 | 5.2 | 7.1 |
MAPS's Quality Factors
The “Quality” component of the POWR Ratings focuses on 31 different factors of a companies fundamentals and operational strength. Here are some key insights as we drill into the specifics of these quality attributes.- MAPS has a Quality Grade of C, ranking ahead of 57.36% of graded US stocks.
- MAPS's asset turnover comes in at 1.073 -- ranking 118th of 563 Business Services stocks.
- 500 - Internal server error
The table below shows MAPS's key quality metrics over time.
Period | Asset Turnover | Gross Margin | ROIC |
---|---|---|---|
2021-06-30 | 1.073 | 0.954 | 0.236 |
2021-03-31 | 0.944 | 0.953 | 0.212 |
2020-12-31 | 0.635 | 0.953 | 0.153 |
2020-12-31 | 0.000 | NA | -0.205 |
2020-12-31 | 0.000 | NA | -0.006 |
2020-06-30 | 0.000 | NA | 0.012 |
MAPS Price Target
For more insight on analysts targets of MAPS, see our MAPS price target page. And for a list of of all stocks sorted by upside potential based on analyst target price, see our Top Price Target page.
Average Price Target | $18.75 | Average Broker Recommendation | 1.25 (Strong Buy) |
MAPS Stock Price Chart Interactive Chart >
MAPS Price/Volume Stats
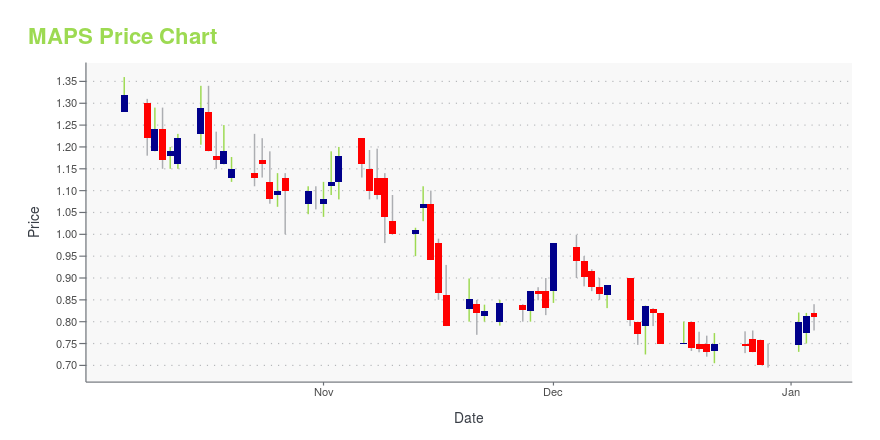
Current price | $0.84 | 52-week high | $8.35 |
Prev. close | $0.87 | 52-week low | $0.77 |
Day low | $0.81 | Volume | 546,800 |
Day high | $0.87 | Avg. volume | 627,783 |
50-day MA | $1.12 | Dividend yield | N/A |
200-day MA | $2.13 | Market Cap | 123.42M |
WM Holding Company, LLC (MAPS) Company Bio
WM Technology, Inc. engages in the operation of a listings marketplace with SaaS subscription offerings sold to retailers and brands in the U.S. state-legal and Canadian cannabis markets. It also provides information on the cannabis plant and the industry and advocates for legalization. The company was founded by Douglas Francis and Justin Hartfield in 2008 and is headquartered in Irvine, CA.
Latest MAPS News From Around the Web
Below are the latest news stories about WM TECHNOLOGY INC that investors may wish to consider to help them evaluate MAPS as an investment opportunity.
WM Technology, Inc. Reports Fourth Quarter and Full Year 2022 Financial ResultsIRVINE, Calif., March 16, 2023--WM Technology, Inc. ("WM Technology" or the "Company") (Nasdaq: MAPS), a leading technology and technology solutions provider to the cannabis industry, today announced its financial results for the fourth quarter ending December 31, 2022. |
WM Technology, Inc. Announces Fourth Quarter 2022 Financial Results Conference CallIRVINE, Calif., February 24, 2023--WM Technology, Inc. ("WM Technology" or the "Company") (Nasdaq: MAPS), the leading marketplace and technology solutions provider to the cannabis industry, today announced it will report financial results for its fourth quarter ended December 31, 2022 after market close on Thursday, March 16, 2023. Management will host a conference call and webcast to discuss the Company's financial results at 2:00 p.m. Pacific Time (or 5:00 p.m. Eastern Time) on the same day. A |
WM Technology, Inc. Announces Participation at ICR ConferenceIRVINE, Calif., January 04, 2023--WM Technology, Inc. ("WM Technology" or the "Company") (Nasdaq: MAPS), the leading marketplace and technology solutions provider to the cannabis industry, today announced it will be presenting and taking investor meetings at the 2023 ICR Conference located at the Grande Lakes Orlando Resort in Orlando, Florida. |
WM Technology, Inc. (NASDAQ:MAPS) Q3 2022 Earnings Call TranscriptWM Technology, Inc. (NASDAQ:MAPS) Q3 2022 Earnings Call Transcript November 7, 2022 WM Technology, Inc. reports earnings inline with expectations. Reported EPS is $-0.06 EPS, expectations were $-0.06. Operator: Good afternoon everyone and welcome to the WM Technology Inc.’s Third Quarter 2022 Earnings Conference Call. I would now like to turn the call over to […] |
Kaleyra Announces CEO Transition Plan and Significant Board EnhancementsKaleyra, Inc. (NYSE: KLR) (NYSE American: KLR WS) ("Kaleyra" or the "Company"), an enterprise Communication Platform as a Service (CPaaS) business, today announced a CEO transition plan and significant enhancements to its Board of Directors (the "Board") to reposition the Company for sustainable growth and value creation. |
MAPS Price Returns
1-mo | -29.41% |
3-mo | -9.39% |
6-mo | -52.00% |
1-year | -87.50% |
3-year | -91.17% |
5-year | N/A |
YTD | -16.83% |
2022 | -83.11% |
2021 | -53.17% |
2020 | 28.86% |
2019 | N/A |
2018 | N/A |
Loading social stream, please wait...