
Marubeni Corp. ADR (MARUY): Price and Financial Metrics
MARUY Price/Volume Stats
| Current price | $185.50 | 52-week high | $203.84 |
| Prev. close | $182.05 | 52-week low | $141.45 |
| Day low | $181.00 | Volume | 4,374 |
| Day high | $185.70 | Avg. volume | 6,843 |
| 50-day MA | $190.81 | Dividend yield | 2.28% |
| 200-day MA | $170.90 | Market Cap | 31.10B |
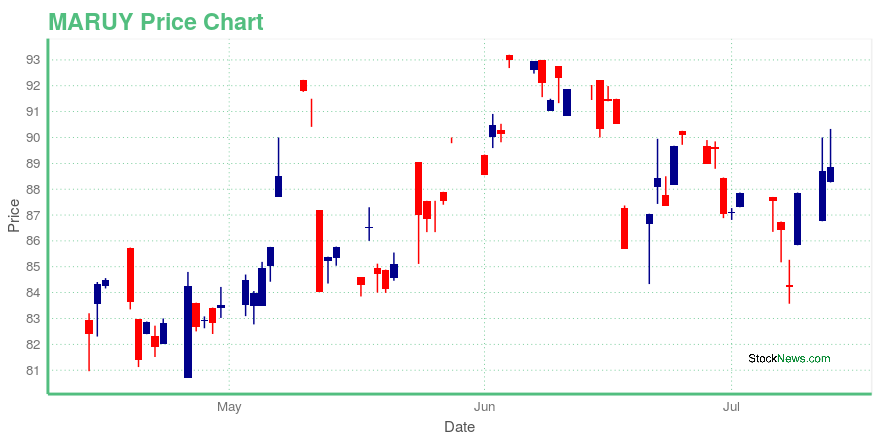
MARUY Stock Price Chart Interactive Chart >
Marubeni Corp. ADR (MARUY) Company Bio
Marubeni Corporation (丸紅株式会社, Marubeni Kabushiki-gaisha) (TYO: 8002, OSE: 8002, NSE: 8002) is a sōgō shōsha (general trading company) headquartered in Nihonbashi, Chuo, Tokyo, Japan. It is one of the largest sogo shosha and has leading market shares in cereal and paper pulp trading as well as a strong electrical and industrial plant business. Marubeni is a member of the Mizuho keiretsu. (Source:Wikipedia)
MARUY Price Returns
| 1-mo | 0.82% |
| 3-mo | 6.30% |
| 6-mo | 12.22% |
| 1-year | 8.49% |
| 3-year | 141.07% |
| 5-year | N/A |
| YTD | 19.81% |
| 2023 | 41.25% |
| 2022 | 23.13% |
| 2021 | 51.73% |
| 2020 | N/A |
| 2019 | 0.00% |
MARUY Dividends
| Ex-Dividend Date | Type | Payout Amount | Change | ||||||
|---|---|---|---|---|---|---|---|---|---|
| Loading, please wait... | |||||||||
Loading social stream, please wait...