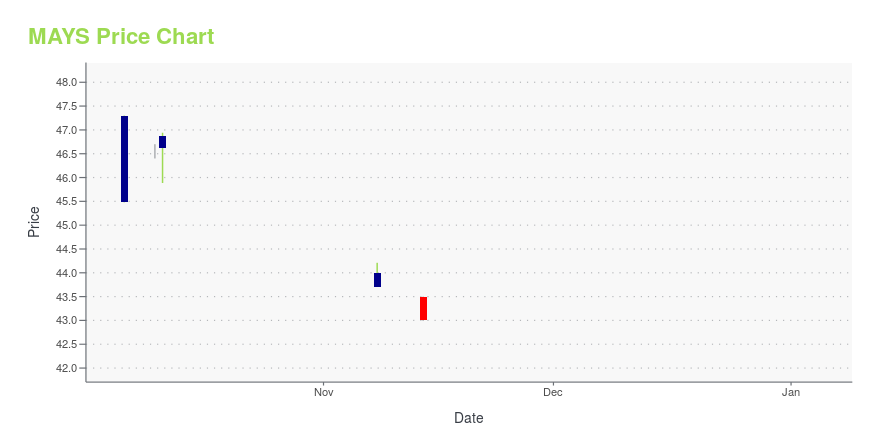
J. W. Mays, Inc. (MAYS): Price and Financial Metrics

J. W. Mays, Inc. (MAYS): $46.51

0.50 (+1.09%)

POWR Rating

Component Grades

Momentum

NR

Stability

NR

Sentiment

Quality

NR

Add MAYS to Watchlist
Sign Up

Industry: Real Estate Services

Industry

NR

Ranked


in industry

MAYS Price/Volume Stats

Current price $46.51 52-week high $56.12
Prev. close $46.01 52-week low $36.10
Day low $46.51 Volume 600
Day high $46.51 Avg. volume 747
50-day MA $45.93 Dividend yield N/A
200-day MA $44.25 Market Cap 93.76M

MAYS Stock Price Chart Interactive Chart >

MAYS Stock Summary

  • MAYS's one year PEG ratio, measuring expected growth in earnings next year relative to current common stock price is 74,195.75 -- higher than 100% of US-listed equities with positive expected earnings growth.
  • The price/operating cash flow metric for MAYS J W INC is higher than 90.65% of stocks in our set with a positive cash flow.
  • In terms of volatility of its share price, MAYS is more volatile than merely 4.66% of stocks we're observing.
  • If you're looking for stocks that are quantitatively similar to MAYS J W INC, a group of peers worth examining would be SPG, PRPO, SUI, CTBI, and SNPS.
  • MAYS's SEC filings can be seen here. And to visit MAYS J W INC's official web site, go to www.jwmays.com.

MAYS Valuation Summary

  • In comparison to the median Real Estate stock, MAYS's price/earnings ratio is 87274.72% lower, now standing at -23450.
  • MAYS's price/sales ratio has moved up 2.1 over the prior 243 months.

Below are key valuation metrics over time for MAYS.

Stock Date P/S P/B P/E EV/EBIT
MAYS 2023-09-20 4.1 1.8 -23450 635.8
MAYS 2023-09-19 4.1 1.8 -23450 635.8
MAYS 2023-09-18 4.1 1.7 -23175 630.1
MAYS 2023-09-15 4.3 1.8 -24350 654.4
MAYS 2023-09-14 4.1 1.7 -23200 630.6
MAYS 2023-09-13 4.2 1.8 -24025 647.7

MAYS Growth Metrics

    Its 3 year net cashflow from operations growth rate is now at -42.71%.
  • Its 4 year price growth rate is now at -35.27%.
  • Its 5 year net income to common stockholders growth rate is now at -92.89%.
Over the past 49 months, MAYS's revenue has gone up $2,573,782.

The table below shows MAYS's growth in key financial areas (numbers in millions of US dollars).

Date Revenue Operating Cash Flow Net Income to Common Stock
2022-09-30 22.08622 2.92393 -0.262104
2022-06-30 21.39604 1.689445 -0.712371
2022-03-31 21.06111 2.133812 0.265867
2021-12-31 20.73891 1.731096 0.280983
2021-09-30 20.45743 1.199068 0.422706
2021-06-30 20.21288 1.06843 0.398032


MAYS Latest News Stream


Event/Time News Detail
Loading, please wait...

MAYS Latest Social Stream


Loading social stream, please wait...

View Full MAYS Social Stream

Latest MAYS News From Around the Web

Below are the latest news stories about MAYS J W INC that investors may wish to consider to help them evaluate MAYS as an investment opportunity.

J.W. Mays, Inc. (NASDAQ:MAYS) most popular amongst private companies who own 58%, insiders hold 17%

Key Insights The considerable ownership by private companies in J.W. Mays indicates that they collectively have a...

Yahoo | August 15, 2023

J.W. Mays' (NASDAQ:MAYS) investors will be pleased with their respectable 99% return over the last three years

By buying an index fund, investors can approximate the average market return. But if you pick the right individual...

Yahoo | June 7, 2023

Calculating The Intrinsic Value Of J.W. Mays, Inc. (NASDAQ:MAYS)

Key Insights Using the 2 Stage Free Cash Flow to Equity, J.W. Mays fair value estimate is US$36.54 With US$43.50 share...

Yahoo | April 19, 2023

J.W. Mays Second Quarter 2023 Earnings: EPS: US$0.022 (vs US$0.097 loss in 2Q 2022)

J.W. Mays ( NASDAQ:MAYS ) Second Quarter 2023 Results Key Financial Results Revenue: US$5.84m (up 9.6% from 2Q 2022...

Yahoo | March 10, 2023

J.W. Mays' (NASDAQ:MAYS) investors will be pleased with their notable 49% return over the last three years

One simple way to benefit from the stock market is to buy an index fund. But if you choose individual stocks with...

Yahoo | December 12, 2022

Read More 'MAYS' Stories Here

MAYS Price Returns

1-mo N/A
3-mo 6.31%
6-mo N/A
1-year 20.43%
3-year N/A
5-year N/A
YTD N/A
2022 0.00%
2021 N/A
2020 N/A
2019 0.00%
2018 -0.74%

Continue Researching MAYS

Want to see what other sources are saying about Mays J W Inc's financials and stock price? Try the links below:

Mays J W Inc (MAYS) Stock Price | Nasdaq
Mays J W Inc (MAYS) Stock Quote, History and News - Yahoo Finance
Mays J W Inc (MAYS) Stock Price and Basic Information | MarketWatch

Get Free Updates

Join thousands of investors who get the latest news, insights and top rated picks from StockNews.com!