Marcus Corporation (The) (MCS): Price and Financial Metrics

Marcus Corporation (The) (MCS): $14.17

0.11 (-0.77%)

POWR Rating

Component Grades

Momentum

C

Stability

C

Sentiment

Quality

B

Add MCS to Watchlist
Sign Up

Industry: Travel - Hotels/Resorts

Industry

C

Ranked

#5 of 20

in industry

MCS Price/Volume Stats

Current price $14.17 52-week high $18.05
Prev. close $14.28 52-week low $13.62
Day low $14.04 Volume 792,000
Day high $14.30 Avg. volume 293,446
50-day MA $15.30 Dividend yield 1.93%
200-day MA $15.64 Market Cap 449.13M

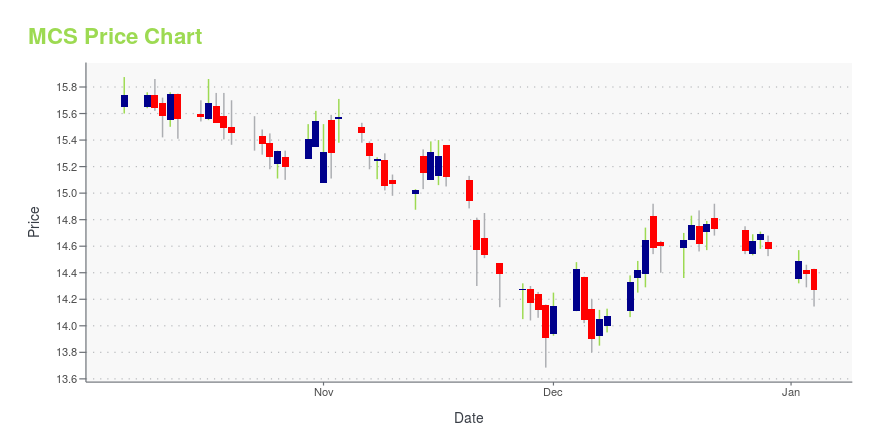
MCS Stock Price Chart Interactive Chart >

MCS POWR Grades

  • Growth is the dimension where MCS ranks best; there it ranks ahead of 89.95% of US stocks.
  • The strongest trend for MCS is in Sentiment, which has been heading up over the past 177 days.
  • MCS ranks lowest in Sentiment; there it ranks in the 23rd percentile.

MCS Stock Summary

  • With a price/earnings ratio of 69.08, MARCUS CORP P/E ratio is greater than that of about 91.78% of stocks in our set with positive earnings.
  • The volatility of MARCUS CORP's share price is greater than that of merely 4.76% US stocks with at least 200 days of trading history.
  • Shareholder yield, a measure of how much is returned to shareholders via dividends and share repurchases, for MCS comes in at 14.86% -- higher than that of 86.86% of stocks in our set.
  • If you're looking for stocks that are quantitatively similar to MARCUS CORP, a group of peers worth examining would be MGLD, USNA, TXRH, LOCO, and AXS.
  • MCS's SEC filings can be seen here. And to visit MARCUS CORP's official web site, go to www.marcuscorp.com.

MCS Valuation Summary

  • In comparison to the median Communication Services stock, MCS's price/earnings ratio is 338.1% higher, now standing at 69.
  • Over the past 243 months, MCS's price/sales ratio has gone down 0.4.

Below are key valuation metrics over time for MCS.

Stock Date P/S P/B P/E EV/EBIT
MCS 2023-11-09 0.7 1 69.0 24.2
MCS 2023-11-08 0.7 1 69.9 24.4
MCS 2023-11-07 0.7 1 70.0 24.4
MCS 2023-11-06 0.7 1 70.8 24.6
MCS 2023-11-03 0.7 1 71.4 24.7
MCS 2023-11-02 0.7 1 70.1 24.4

MCS Growth Metrics

    Its 5 year price growth rate is now at -65.68%.
  • Its 2 year cash and equivalents growth rate is now at -81.52%.
  • Its 4 year price growth rate is now at -65.68%.
MCS's revenue has moved down $137,368,000 over the prior 33 months.

The table below shows MCS's growth in key financial areas (numbers in millions of US dollars).

Date Revenue Operating Cash Flow Net Income to Common Stock
2022-09-30 683.495 104.556 3.791
2022-06-30 645.707 111.16 2.261
2022-03-31 539.699 65.705 -30.065
2021-12-31 458.244 46.251 -43.293
2021-09-30 325.9 14.152 -88.759
2021-06-30 213.629 -23.219 -129.958

MCS's Quality Factors

The “Quality” component of the POWR Ratings focuses on 31 different factors of a companies fundamentals and operational strength. Here are some key insights as we drill into the specifics of these quality attributes.
  • MCS has a Quality Grade of C, ranking ahead of 31.07% of graded US stocks.
  • MCS's asset turnover comes in at 0.17 -- ranking 34th of 44 Entertainment stocks.
  • CNK, LYV, and FUN are the stocks whose asset turnover ratios are most correlated with MCS.

The table below shows MCS's key quality metrics over time.

Period Asset Turnover Gross Margin ROIC
2021-07-01 0.170 0.265 -0.106
2021-04-01 0.099 0.115 -0.121
2020-12-31 0.176 0.215 -0.111
2020-09-24 0.295 0.317 -0.070
2020-06-25 0.422 0.366 -0.026
2020-03-26 0.590 0.388 0.023

MCS Price Target

For more insight on analysts targets of MCS, see our MCS price target page. And for a list of of all stocks sorted by upside potential based on analyst target price, see our Top Price Target page.

Average Price Target $24.33 Average Broker Recommendation 1.33 (Strong Buy)

Marcus Corporation (The) (MCS) Company Bio


The Marcus Corporation operates through two segments, Movie Theatres, and Hotels and Resorts. The company operates movie theatres in Wisconsin, Illinois, Iowa, Minnesota, Nebraska, North Dakota, and Ohio, and hotels, resorts, and other properties for third parties in Wisconsin, California, Georgia, Minnesota, Nevada, Florida, and Texas. The company was founded in 1935 and is based in Milwaukee, Wisconsin.


MCS Latest News Stream


Event/Time News Detail
Loading, please wait...

MCS Latest Social Stream


Loading social stream, please wait...

View Full MCS Social Stream

Latest MCS News From Around the Web

Below are the latest news stories about MARCUS CORP that investors may wish to consider to help them evaluate MCS as an investment opportunity.

Here's Why We're Wary Of Buying Marcus' (NYSE:MCS) For Its Upcoming Dividend

Regular readers will know that we love our dividends at Simply Wall St, which is why it's exciting to see The Marcus...

Yahoo | November 19, 2023

Is Now The Time To Look At Buying The Marcus Corporation (NYSE:MCS)?

The Marcus Corporation ( NYSE:MCS ), might not be a large cap stock, but it saw significant share price movement during...

Yahoo | November 16, 2023

The Marcus Corporation Announces New Corporate Headquarters in Milwaukee

MILWAUKEE, November 13, 2023--The Marcus Corporation (NYSE: MCS) announced today that it will be relocating and expanding its corporate and divisional headquarters to the Associated Bank River Center located at 111 East Kilbourn Avenue in Milwaukee. The company will move to its new location in late spring or early summer 2024.

Yahoo | November 13, 2023

No Feel-Good Hollywood Ending for AMC Stock

AMC stock fans received good news in terms of estimate-beating revenue and EPS.

Paul R. La Monica on InvestorPlace | November 9, 2023

The Marcus Corporation Declares Quarterly Dividend

MILWAUKEE, November 08, 2023--Directors of The Marcus Corporation (NYSE: MCS) today declared a regular quarterly cash dividend of $0.07 per share of common stock. The dividend will be paid December 15, 2023, to shareholders of record on November 27, 2023.

Yahoo | November 8, 2023

Read More 'MCS' Stories Here

MCS Price Returns

1-mo -7.60%
3-mo -6.26%
6-mo -8.20%
1-year -10.75%
3-year 15.88%
5-year -65.04%
YTD 0.04%
2022 -18.93%
2021 32.49%
2020 -57.29%
2019 -18.13%
2018 46.99%

MCS Dividends

Ex-Dividend Date Type Payout Amount Change
Loading, please wait...
View Full MCS Dividend History

Get Free Updates

Join thousands of investors who get the latest news, insights and top rated picks from StockNews.com!