
TRxADE HEALTH Inc. (MEDS): Price and Financial Metrics
MEDS Price/Volume Stats
| Current price | $6.31 | 52-week high | $44.56 |
| Prev. close | $6.26 | 52-week low | $3.69 |
| Day low | $5.82 | Volume | 14,600 |
| Day high | $6.42 | Avg. volume | 340,730 |
| 50-day MA | $12.39 | Dividend yield | N/A |
| 200-day MA | $8.05 | Market Cap | 8.87M |
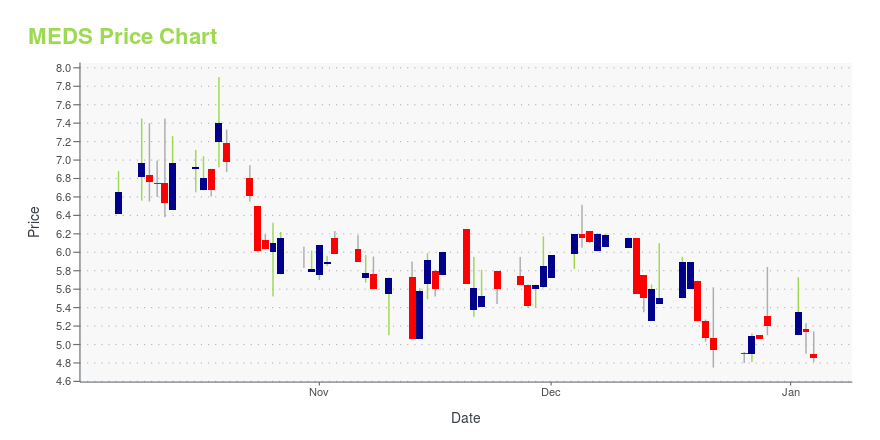
MEDS Stock Price Chart Interactive Chart >
TRxADE HEALTH Inc. (MEDS) Company Bio
Trxade Group, Inc. provides an on-line platform for pharmaceutical purchasers. It owns and operates a business-to-business web-based marketplace focuses on the United States pharmaceutical industry. It operates web-based market platform that enables trade among healthcare buyers and sellers of pharmaceuticals, accessories and services; provides state-licensed pharmacies and buying groups in the United States with pharmaceuticals approved by the United States Food and Drug Administration; and acts as technology consultant provider that supports their programming needs and provides research on pharmaceutical pricing and shortages in acute care and retail settings. The company was founded on July 15, 2005 and is headquartered in Land O' Lakes, FL.
Latest MEDS News From Around the Web
Below are the latest news stories about TRXADE HEALTH INC that investors may wish to consider to help them evaluate MEDS as an investment opportunity.
TRxADE Announces Receipt of Notification of Deficiency from Nasdaq Regarding Requirement to Timely File Quarterly Report on Form 10-Q.TAMPA, FL, Nov. 29, 2023 (GLOBE NEWSWIRE) -- TRxADE HEALTH, INC. (NASDAQ: MEDS) (“TRxADE”), a parent company of a pharmaceutical business-to-business exchange platform, announced today that it received a notice of non-compliance from the Nasdaq Listing Qualifications Department (“Nasdaq”) on November 21, 2023 notifying the Company that, as a result of the Company’s failure to timely file its Quarterly Report on Form 10-Q for the period ended September 30, 2023 (the “Form 10-Q”), the Company is n |
TrxADE Health, Inc. affirms its commitment to the pharmaceutical space via its subsidiary Trxade, Inc. which operates the pharmaceutical marketplace and added more members in the third quarter of 2023.TAMPA, FL, Oct. 17, 2023 (GLOBE NEWSWIRE) -- TRxADE HEALTH, INC. (NASDAQ: MEDS) (“TRxADE”), a parent company of pharmaceutical business-to-business exchange platform, which recently merged with Superlatus, Inc. (“Superlatus”), today reconfirms its commitment to pharmaceutical marketplace via its subsidiary Trxade, Inc. and is pleased to clarify its commitment to the pharmaceutical industry. Trxade, Inc., a subsidiary of Trxade Health, Inc. (the “Company”), will continue to focus on the pharmaceu |
Superlatus Announces Distribution Partnership with North America's Leading Wholesale Distributor and Expanded Points of Retail SalesTAMPA, FL, Oct. 12, 2023 (GLOBE NEWSWIRE) -- Superlatus, Inc. (“Superlatus”), a food technology and distribution company and wholly owned subsidiary of TRxADE HEALTH, Inc. (NASDAQ: MEDS, “TRxADE”), a pharmaceutical exchange platform provider, is pleased to announce that its subsidiary, Superlatus PD Holding Company, has entered into a supplier agreement with Rainforest Distribution Corp. (“Rainforest”), a leading Consumer Packaged Goods distributor serving over 3,000 retailers across 15 states i |
Superlatus, Newly Merged with TRxADE HEALTH, Acquires the assets of Spero Foods, a plant-based tech company Disrupting the Dairy and Egg Industry.Spero is another addition to the growing Superlatus CPG portfolio under their Urgent Company umbrella of brands.Spero® is a plant-based tech company specializing in alternative dairy and egg replacements, on a mission to outcompete traditional dairy and egg products in scale, price, taste, and nutrition by utilizing internationally patent-pending technologies that transforms low-cost, sustainable, and scalable ingredients into plant-based alternatives. Spero’s mission is to scale mainstream dair |
TRxADE Health (NASDAQ:MEDS), Newly Merged With Superlatus, Is Gearing Up To Make Big Splashes In the $151 Billion Snacks Industry with its Acquisition of The Urgent Company Inc.TRxADE Health, Inc.(NASDAQ:MEDS), known for its pharmaceutical exchange platform, has recently merged with Superlatus, Inc., a leading food technology and distribution company. The combined entity has now announced a binding agreement to acquire The Urgent Company Inc. along with its portfolio of popular consumer brands Coolhaus, Brave Robot, Modern Kitchen, and California Performance Co. |
MEDS Price Returns
| 1-mo | N/A |
| 3-mo | 45.22% |
| 6-mo | 8.42% |
| 1-year | 25.87% |
| 3-year | -89.98% |
| 5-year | N/A |
| YTD | 21.43% |
| 2023 | -13.95% |
| 2022 | -82.94% |
| 2021 | -55.39% |
| 2020 | -19.85% |
| 2019 | N/A |
Loading social stream, please wait...