
Mistras Group Inc (MG): Price and Financial Metrics
MG Price/Volume Stats
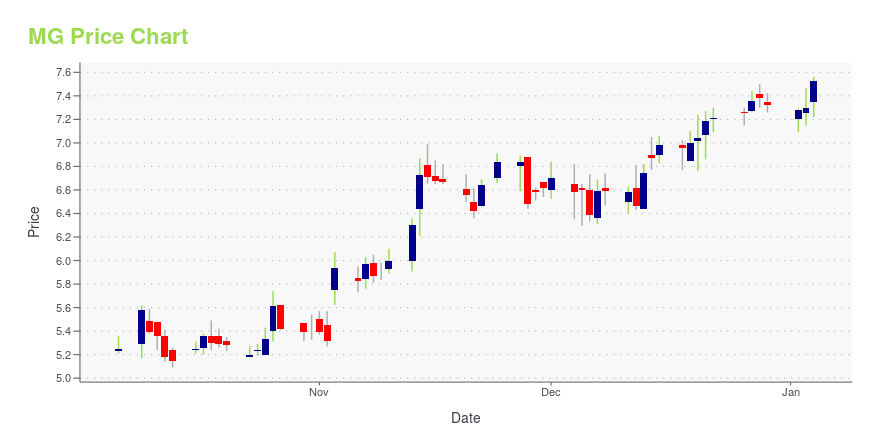
| Current price | $9.98 | 52-week high | $10.15 |
| Prev. close | $9.91 | 52-week low | $4.96 |
| Day low | $9.92 | Volume | 64,252 |
| Day high | $10.15 | Avg. volume | 72,106 |
| 50-day MA | $8.51 | Dividend yield | N/A |
| 200-day MA | $7.91 | Market Cap | 309.05M |
MG Stock Price Chart Interactive Chart >
Mistras Group Inc (MG) Company Bio
Mistras Group, Inc. is a provider of asset protection solutions. The Company offers one source for asset protection solutions to its customers. The Company has three segments: Services, Products and Systems, and International. The Company's Services segment provides asset protection solutions consisting primarily of non-destructive testing and inspection, and engineering services that are used to evaluate the structural integrity and reliability of energy, industrial and public infrastructure. The company was founded in 1978 and is based in Princeton Junction, New Jersey.
Latest MG News From Around the Web
Below are the latest news stories about MISTRAS GROUP INC that investors may wish to consider to help them evaluate MG as an investment opportunity.
Mistras Group, Inc. (NYSE:MG) is largely controlled by institutional shareholders who own 51% of the companyKey Insights Significantly high institutional ownership implies Mistras Group's stock price is sensitive to their... |
Sidoti Events, LLC’s Virtual November Micro-Cap ConferenceNEW YORK, NY / ACCESSWIRE / November 14, 2023 / Sidoti Events, LLC, an affiliate of Sidoti & Company, LLC, has released the presentation schedule and weblinks for its two-day November Micro-Cap Conference taking place Wednesday and Thursday, November ... |
MISTRAS Group to Participate in Sidoti Micro Cap Virtual Conference on November 15-16, 2023Management Presentation to be Webcast Live at 10:45 AM ET on November 16, 2023PRINCETON JUNCTION, N.J., Nov. 08, 2023 (GLOBE NEWSWIRE) -- MISTRAS Group, Inc. (MG: NYSE) – a leading “one source” multinational provider of technology-enabled asset protection solutions used to maximize the uptime and safety of critical energy, industrial, and public infrastructure – announced today that Edward Prajzner, Senior Executive Vice President and Chief Financial Officer, will be presenting at the Sidoti Mic |
Mistras Group, Inc. (NYSE:MG) Q3 2023 Earnings Call TranscriptMistras Group, Inc. (NYSE:MG) Q3 2023 Earnings Call Transcript November 3, 2023 Mistras Group, Inc. beats earnings expectations. Reported EPS is $0.18, expectations were $0.16. Operator: Thank you for joining Mistras Group’s Conference Call for its Third Quarter Ended September 30, 2023. My name is Michelle, and I will be your event manager today. We […] |
MISTRAS Group Inc (MG) Reports Q3 2023 Earnings: Revenue and Gross Profit Margin Increase Amid ...Company experiences growth in Commercial Aerospace and Data Analytical Solutions Markets, while reducing quarterly SG&A expenses |
MG Price Returns
| 1-mo | 25.85% |
| 3-mo | 11.51% |
| 6-mo | 26.17% |
| 1-year | 33.60% |
| 3-year | -2.54% |
| 5-year | -33.47% |
| YTD | 36.34% |
| 2023 | 48.48% |
| 2022 | -33.65% |
| 2021 | -4.25% |
| 2020 | -45.62% |
| 2019 | -0.76% |
Continue Researching MG
Want to see what other sources are saying about Mistras Group Inc's financials and stock price? Try the links below:Mistras Group Inc (MG) Stock Price | Nasdaq
Mistras Group Inc (MG) Stock Quote, History and News - Yahoo Finance
Mistras Group Inc (MG) Stock Price and Basic Information | MarketWatch
Loading social stream, please wait...