Magnite Inc. (MGNI): Price and Financial Metrics

Magnite Inc. (MGNI): $11.67

-0.25 (-2.10%)

POWR Rating

Component Grades

Momentum

F

Stability

D

Sentiment

Quality

C

Add MGNI to Watchlist
Sign Up

Industry: Advertising

Industry

C

Ranked

#15 of 17

in industry

MGNI Price/Volume Stats

Current price $11.67 52-week high $14.20
Prev. close $11.92 52-week low $5.59
Day low $11.51 Volume 580,613
Day high $11.89 Avg. volume 1,633,385
50-day MA $9.82 Dividend yield N/A
200-day MA $9.53 Market Cap 1.58B

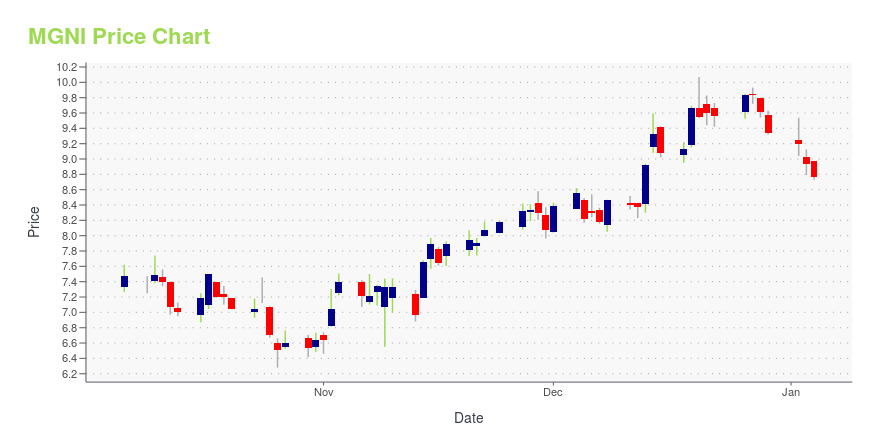
MGNI Stock Price Chart Interactive Chart >

MGNI POWR Grades

  • MGNI scores best on the Sentiment dimension, with a Sentiment rank ahead of 71.37% of US stocks.
  • MGNI's strongest trending metric is Stability; it's been moving up over the last 179 days.
  • MGNI's current lowest rank is in the Momentum metric (where it is better than 3.46% of US stocks).

MGNI Stock Summary

  • MGNI's equity multiplier -- a measure of assets relative to shareholders'equity -- is greater than that of 69.39% of US stocks.
  • Over the past twelve months, MGNI has reported earnings growth of 54.53%, putting it ahead of 80.33% of US stocks in our set.
  • The volatility of MAGNITE INC's share price is greater than that of 71.86% US stocks with at least 200 days of trading history.
  • Stocks with similar financial metrics, market capitalization, and price volatility to MAGNITE INC are DVAX, STEM, LMND, LNSR, and EGHT.
  • Visit MGNI's SEC page to see the company's official filings. To visit the company's web site, go to www.rubiconproject.com.

MGNI Valuation Summary

  • MGNI's price/sales ratio is 2.6; this is 44.44% higher than that of the median Consumer Cyclical stock.
  • MGNI's EV/EBIT ratio has moved up 63.9 over the prior 111 months.

Below are key valuation metrics over time for MGNI.

Stock Date P/S P/B P/E EV/EBIT
MGNI 2023-05-19 2.6 2.2 -8.4 -13.1
MGNI 2023-05-18 2.7 2.3 -8.6 -13.4
MGNI 2023-05-17 2.5 2.1 -8.0 -12.7
MGNI 2023-05-16 2.5 2.1 -7.8 -12.5
MGNI 2023-05-15 2.7 2.2 -8.5 -13.2
MGNI 2023-05-12 2.7 2.3 -8.8 -13.6

MGNI Growth Metrics

    Its 3 year price growth rate is now at 60.91%.
  • Its 2 year net cashflow from operations growth rate is now at 394.82%.
  • Its 3 year revenue growth rate is now at 297.64%.
Over the past 70 months, MGNI's revenue has gone up $322,065,000.

The table below shows MGNI's growth in key financial areas (numbers in millions of US dollars).

Date Revenue Operating Cash Flow Net Income to Common Stock
2022-12-31 577.069 192.55 -130.323
2022-09-30 562.956 172.434 -93.485
2022-06-30 549.012 163.13 -93.413
2022-03-31 525.773 149.447 -31.651
2021-12-31 468.413 126.589 0.065
2021-09-30 389.13 69.973 5.498

MGNI's Quality Factors

The “Quality” component of the POWR Ratings focuses on 31 different factors of a companies fundamentals and operational strength. Here are some key insights as we drill into the specifics of these quality attributes.
  • MGNI has a Quality Grade of C, ranking ahead of 35.54% of graded US stocks.
  • MGNI's asset turnover comes in at 0.215 -- ranking 479th of 563 Business Services stocks.
  • CELP, FTAI, and PYPL are the stocks whose asset turnover ratios are most correlated with MGNI.

The table below shows MGNI's key quality metrics over time.

Period Asset Turnover Gross Margin ROIC
2021-09-30 0.215 0.599 -0.136
2021-06-30 0.229 0.643 -0.176
2021-03-31 0.261 0.657 -0.334
2020-12-31 0.308 0.649 -0.959
2020-09-30 0.323 0.628 -1.379
2020-06-30 0.366 0.619 -1.527

MGNI Price Target

For more insight on analysts targets of MGNI, see our MGNI price target page. And for a list of of all stocks sorted by upside potential based on analyst target price, see our Top Price Target page.

Average Price Target $48.44 Average Broker Recommendation 1.5 (Moderate Buy)

Magnite Inc. (MGNI) Company Bio


Magnite, Inc. provides a technology solution to automate the purchase and sale of digital advertising inventory for buyers and sellers. It features applications and services for digital advertising sellers, including Websites, mobile applications and other digital media properties. The company was founded by Frank Addante, Duc Chau, Craig Roah, Julie Mattern and Brian D. Baumgart on April 20, 2007 and is headquartered in Los Angeles, CA


MGNI Latest News Stream


Event/Time News Detail
Loading, please wait...

MGNI Latest Social Stream


Loading social stream, please wait...

View Full MGNI Social Stream

Latest MGNI News From Around the Web

Below are the latest news stories about MAGNITE INC that investors may wish to consider to help them evaluate MGNI as an investment opportunity.

The Trade Desk Stock: Bear vs. Bull

If you had invested $1,000 in The Trade Desk (NASDAQ: TTD) when it went public in September 2016, your investment would be worth nearly $37,000 today. Between 2016 and 2021, its annual revenue rose at a compound annual growth rate (CAGR) of 43% as its net income grew at a CAGR of 46%. The Trade Desk is the world's largest independent demand-side platform (DSP) for digital ads.

Yahoo | May 19, 2023

Magnite Stock Clears Technical Benchmark, Hitting 80-Plus RS Rating

IBD's proprietary RS Rating identifies technical performance by using a 1 (worst) to 99 (best) score that shows how a stock's price performance over the trailing 52 weeks matches up against the rest of the market. Magnite stock is working on a cup without handle with a 14.30 buy point. Magnite stock earns the No. 26 rank among its peers in the Computer Software-Enterprise industry group.

Yahoo | May 12, 2023

Q1 2023 Magnite Inc Earnings Call

Q1 2023 Magnite Inc Earnings Call

Yahoo | May 11, 2023

These 2 Adtech Stocks Could Be Signaling a Recovery

Stock market volatility appeared poised to continue on Thursday, as stock index futures were mixed in premarket trading. Both The Trade Desk (NASDAQ: TTD) and Magnite (NASDAQ: MGNI) saw sizable gains in premarket trading, and their latest financial results could offer a rebuttal to those who are convinced that a downbeat future is inevitable. Read on to learn more about what Magnite and The Trade Desk said.

Yahoo | May 11, 2023

Magnite (MGNI) Q1 2023 Earnings Call Transcript

Joining me on the call today are Michael Barrett, CEO; and David Day, our CFO. Before we get started, I will remind you that our prepared remarks and answers to questions will include information that might be considered to be forward-looking statements, including, but not limited to, statements concerning our anticipated financial performance and strategic objectives, including the potential impacts of macroeconomic factors on our business.

Yahoo | May 11, 2023

Read More 'MGNI' Stories Here

MGNI Price Returns

1-mo 24.28%
3-mo 8.26%
6-mo -7.82%
1-year 6.19%
3-year 86.12%
5-year 386.25%
YTD 10.20%
2022 -39.49%
2021 -43.02%
2020 276.35%
2019 118.77%
2018 99.47%

Get Free Updates

Join thousands of investors who get the latest news, insights and top rated picks from StockNews.com!