Melco Resorts & Entertainment Limited (MLCO): Price and Financial Metrics

Melco Resorts & Entertainment Limited (MLCO): $11.08

-0.01 (-0.09%)

POWR Rating

Component Grades

Growth

S

Value

I

Momentum

G

Stability

N

Sentiment

U

Quality

P

MLCO Price/Volume Stats

Current price $11.08 52-week high $14.45
Prev. close $11.09 52-week low $4.70
Day low $11.01 Volume 1,500,500
Day high $11.22 Avg. volume 3,545,290
50-day MA $12.41 Dividend yield N/A
200-day MA $10.00 Market Cap 4.93B

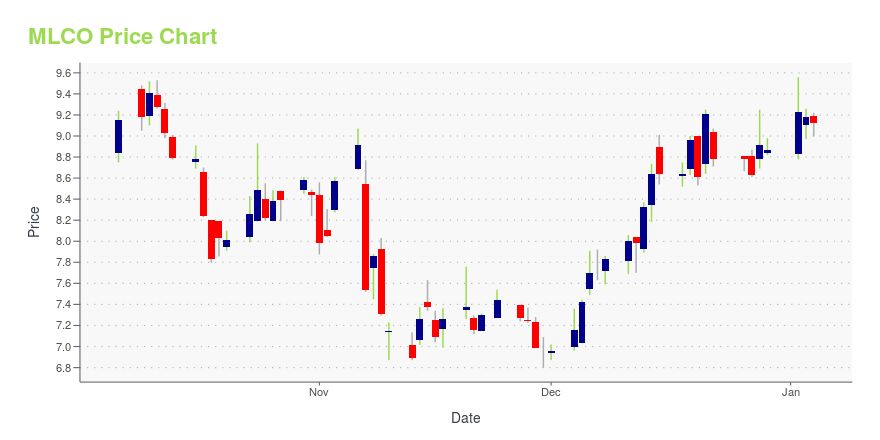
MLCO Stock Price Chart Interactive Chart >

MLCO POWR Grades

  • Sentiment is the dimension where MLCO ranks best; there it ranks ahead of 93.31% of US stocks.
  • MLCO's strongest trending metric is Growth; it's been moving up over the last 178 days.
  • MLCO ranks lowest in Quality; there it ranks in the 8th percentile.

MLCO Stock Summary

  • MELCO RESORTS & ENTERTAINMENT LTD's capital turnover -- a measure of revenue relative to shareholder's equity -- is better than just 4.72% of US listed stocks.
  • Equity multiplier, or assets relative to shareholders' equity, comes in at -20.79 for MELCO RESORTS & ENTERTAINMENT LTD; that's greater than it is for merely 1.1% of US stocks.
  • Revenue growth over the past 12 months for MELCO RESORTS & ENTERTAINMENT LTD comes in at -32.92%, a number that bests just 6.73% of the US stocks we're tracking.
  • Stocks with similar financial metrics, market capitalization, and price volatility to MELCO RESORTS & ENTERTAINMENT LTD are PLNT, PRTH, WE, WYNN, and SEAS.
  • MLCO's SEC filings can be seen here. And to visit MELCO RESORTS & ENTERTAINMENT LTD's official web site, go to www.melco-resorts.com.

MLCO Valuation Summary

  • MLCO's EV/EBIT ratio is -23.1; this is 269.85% lower than that of the median Consumer Cyclical stock.
  • Over the past 199 months, MLCO's price/earnings ratio has gone up 1.9.

Below are key valuation metrics over time for MLCO.

Stock Date P/S P/B P/E EV/EBIT
MLCO 2023-05-05 4.4 -7.0 -6.4 -23.1
MLCO 2023-05-04 4.3 -6.8 -6.2 -22.8
MLCO 2023-05-03 4.3 -6.9 -6.3 -23.0
MLCO 2023-05-02 4.5 -7.2 -6.6 -23.4
MLCO 2023-05-01 4.6 -7.4 -6.7 -23.7
MLCO 2023-04-28 4.6 -7.3 -6.7 -23.6

MLCO Growth Metrics

    Its 5 year revenue growth rate is now at -61.77%.
  • The year over year cash and equivalents growth rate now stands at 22.57%.
  • The 3 year revenue growth rate now stands at 26.94%.
MLCO's revenue has moved down $4,008,878,000 over the prior 12 months.

The table below shows MLCO's growth in key financial areas (numbers in millions of US dollars).

Date Revenue Operating Cash Flow Net Income to Common Stock
2020-12-31 1,727.923 -860.963 -1,263.492
2019-12-31 5,736.801 836.162 373.173
2018-12-31 5,158.509 1,056.698 351.515
2017-12-31 5,284.823 1,162.5 347.002
2016-12-31 4,519.396 1,158.128 175.906

MLCO's Quality Factors

The “Quality” component of the POWR Ratings focuses on 31 different factors of a companies fundamentals and operational strength. Here are some key insights as we drill into the specifics of these quality attributes.
  • MLCO has a Quality Grade of D, ranking ahead of 12.56% of graded US stocks.
  • MLCO's asset turnover comes in at 0.187 -- ranking 68th of 79 Restaraunts Hotels Motels stocks.
  • 500 - Internal server error

The table below shows MLCO's key quality metrics over time.

Period Asset Turnover Gross Margin ROIC
2020-12-31 0.187 0.110 -0.086
2019-12-31 0.625 0.366 0.073
2018-12-31 0.581 0.357 0.072
2017-12-31 0.580 0.328 0.066
2016-12-31 0.458 0.311 0.043
2015-12-31 0.381 0.296 0.024

Melco Resorts & Entertainment Limited (MLCO) Company Bio


Melco Resorts & Entertainment develops, owns, and operates casino gaming and entertainment resort facilities in Asia. The company was founded in 2004 and is based in Central, Hong Kong.


MLCO Latest News Stream


Event/Time News Detail
Loading, please wait...

MLCO Latest Social Stream


Loading social stream, please wait...

View Full MLCO Social Stream

Latest MLCO News From Around the Web

Below are the latest news stories about MELCO RESORTS & ENTERTAINMENT LTD that investors may wish to consider to help them evaluate MLCO as an investment opportunity.

Melco Resorts & Entertainment Limited (NASDAQ:MLCO) Q1 2023 Earnings Call Transcript

Melco Resorts & Entertainment Limited (NASDAQ:MLCO) Q1 2023 Earnings Call Transcript May 10, 2023 Operator: Ladies and gentlemen, thank you for participating in the First Quarter 2023 Earnings Conference Call of Melco Resorts & Entertainment Limited. [Operator Instructions] Today’s conference is being recorded. I would now like to turn the call over to Ms. Jeanny […]

Yahoo | May 13, 2023

Top Consumer Discretionary Stocks for May 2023

Light & Wonder, PENN Entertainment, and Luckin Coffee are the top consumer discretionary stocks for best value, fastest growth, and most momentum, respectively.

Yahoo | May 12, 2023

EV Maker VinFast Strikes $23 Billion SPAC Deal

Vietnamese electric-vehicle maker VinFast is going public through a SPAC deal that would value the combined company at $23 billion, shifting gears in its path to public markets after it [initially filed for a U.

Yahoo | May 12, 2023

Melco announces City of Dreams Mediterranean is to open in Limassol, Cyprus on July 10, 2023

Europe's largest integrated resort is set to redefine the island's tourism and hospitality sectors. Europe's largest integrated resort is set to redefine the island's tourism and hospitality sectors. 1 1 2 2 Europe's largest integrated resort is set to redefine the island's tourism and hospitality sectors. LIMASSOL, Cyprus, May 12, 2023 (GLOBE NEWSWIRE) -- Melco Resorts & Entertainment is pleased to announce City of Dreams Mediterranean will open on Monday, July 10, 2023. Bringing a one-of-a-kin

Yahoo | May 12, 2023

Melco Resorts & Entertainment First Quarter 2023 Earnings: US$0.18 loss per share (vs US$0.39 loss in 1Q 2022)

Melco Resorts & Entertainment ( NASDAQ:MLCO ) First Quarter 2023 Results Key Financial Results Revenue: US$716.5m (up...

Yahoo | May 11, 2023

Read More 'MLCO' Stories Here

MLCO Price Returns

1-mo -18.77%
3-mo -13.30%
6-mo 29.89%
1-year 109.06%
3-year -30.88%
5-year -63.83%
YTD -3.65%
2022 12.97%
2021 -45.12%
2020 -22.55%
2019 41.18%
2018 -37.90%

Get Free Updates

Join thousands of investors who get the latest news, insights and top rated picks from StockNews.com!


Page generated in 0.7633 seconds.