
Marcus & Millichap, Inc. (MMI): Price and Financial Metrics
MMI Price/Volume Stats
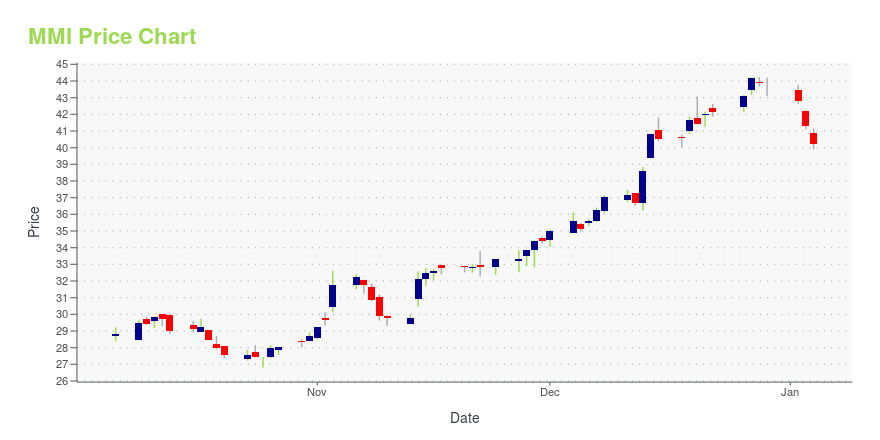
| Current price | $39.87 | 52-week high | $44.24 |
| Prev. close | $39.43 | 52-week low | $26.81 |
| Day low | $39.37 | Volume | 82,094 |
| Day high | $40.25 | Avg. volume | 147,730 |
| 50-day MA | $33.28 | Dividend yield | 1.28% |
| 200-day MA | $34.32 | Market Cap | 1.54B |
MMI Stock Price Chart Interactive Chart >
Marcus & Millichap, Inc. (MMI) Company Bio
Marcus & Millichap provides investment brokerage and financing services to sellers and buyers of various types and sizes of commercial real estate assets in the United States and Canada. The company was founded in 1971 and is based in Calabasas, California.
Latest MMI News From Around the Web
Below are the latest news stories about MARCUS & MILLICHAP INC that investors may wish to consider to help them evaluate MMI as an investment opportunity.
Institutional Property Advisors Closes $80 Million Multifamily Asset Sale in Gilbert, ArizonaGILBERT, Ariz., December 27, 2023--Institutional Property Advisors Closes $80 Million Multifamily Asset Sale in Gilbert, Arizona |
Institutional Property Advisors Brokers $171 Million Ventura County Multifamily Portfolio SaleTHOUSAND OAKS, Calif., December 15, 2023--Institutional Property Advisors Brokers $171 Million Ventura County Multifamily Portfolio Sale |
EquityMultiple Partners With Marcus & Millichap To Deliver Best Real Estate Investment ProductsNEW YORK, NY / ACCESSWIRE / December 13, 2023 / EquityMultiple, the innovative real estate investing platform for self-directed investors, today announced a groundbreaking partnership with Marcus & Millichap (NYSE:MMI), the largest firm specializing ... |
Marcus & Millichap Enters Strategic Partnership with EquityMultipleCALABASAS, Calif., December 06, 2023--Marcus & Millichap (NYSE:MMI), a leading commercial real estate brokerage firm specializing in investment sales, financing, research and advisory services, announced today it has made an equity investment in EquityMultiple, a New York-based real estate financing and investment technology platform. The partnership will provide sponsors and operators supplemental private capital financing sources and give accredited investors streamlined access to unique real |
Institutional Property Advisors Releases Special San Francisco Bay Area Multifamily ReportCALABASAS, Calif., December 05, 2023--Institutional Property Advisors Releases Special San Francisco Bay Area Multifamily Report |
MMI Price Returns
| 1-mo | 28.99% |
| 3-mo | 23.55% |
| 6-mo | 1.93% |
| 1-year | 12.42% |
| 3-year | 11.37% |
| 5-year | 27.20% |
| YTD | -8.06% |
| 2023 | 28.82% |
| 2022 | -30.82% |
| 2021 | 38.22% |
| 2020 | -0.05% |
| 2019 | 8.51% |
MMI Dividends
| Ex-Dividend Date | Type | Payout Amount | Change | ||||||
|---|---|---|---|---|---|---|---|---|---|
| Loading, please wait... | |||||||||
Continue Researching MMI
Want to see what other sources are saying about Marcus & Millichap Inc's financials and stock price? Try the links below:Marcus & Millichap Inc (MMI) Stock Price | Nasdaq
Marcus & Millichap Inc (MMI) Stock Quote, History and News - Yahoo Finance
Marcus & Millichap Inc (MMI) Stock Price and Basic Information | MarketWatch
Loading social stream, please wait...