Molina Healthcare Inc. (MOH): Price and Financial Metrics
MOH Price/Volume Stats
Current price | $286.99 | 52-week high | $374.00 |
Prev. close | $293.14 | 52-week low | $249.78 |
Day low | $284.04 | Volume | 388,700 |
Day high | $294.00 | Avg. volume | 510,725 |
50-day MA | $285.62 | Dividend yield | N/A |
200-day MA | $311.27 | Market Cap | 16.73B |
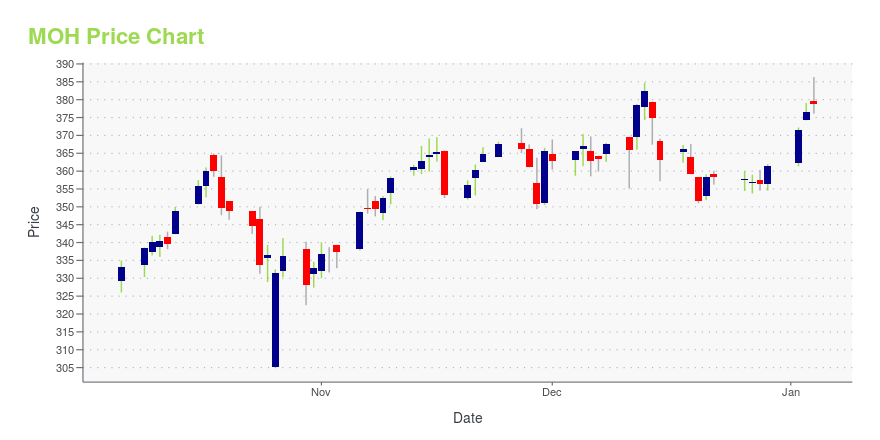
MOH Stock Price Chart Interactive Chart >
MOH POWR Grades
- MOH scores best on the Quality dimension, with a Quality rank ahead of 95.31% of US stocks.
- The strongest trend for MOH is in Growth, which has been heading down over the past 179 days.
- MOH's current lowest rank is in the Momentum metric (where it is better than 51.31% of US stocks).
MOH Stock Summary
- MOH has a market capitalization of $16,425,442,000 -- more than approximately 88.71% of US stocks.
- The capital turnover (annual revenue relative to shareholder's equity) for MOH is 9.84 -- better than 96.19% of US stocks.
- With a price/sales ratio of 0.51, MOLINA HEALTHCARE INC has a higher such ratio than just 17.9% of stocks in our set.
- If you're looking for stocks that are quantitatively similar to MOLINA HEALTHCARE INC, a group of peers worth examining would be LPLA, EXPD, WRB, JBHT, and CASY.
- Visit MOH's SEC page to see the company's official filings. To visit the company's web site, go to www.molinahealthcare.com.
MOH Valuation Summary
- In comparison to the median Healthcare stock, MOH's price/sales ratio is 90.2% lower, now standing at 0.5.
- MOH's price/sales ratio has moved down 0.2 over the prior 242 months.
Below are key valuation metrics over time for MOH.
Stock | Date | P/S | P/B | P/E | EV/EBIT |
---|---|---|---|---|---|
MOH | 2023-05-23 | 0.5 | 5.1 | 19.4 | 11.5 |
MOH | 2023-05-22 | 0.5 | 5.1 | 19.6 | 11.6 |
MOH | 2023-05-19 | 0.5 | 5.1 | 19.4 | 11.5 |
MOH | 2023-05-18 | 0.5 | 5.1 | 19.4 | 11.5 |
MOH | 2023-05-17 | 0.5 | 5.2 | 20.1 | 12.0 |
MOH | 2023-05-16 | 0.5 | 5.1 | 19.7 | 11.7 |
MOH Growth Metrics
- The 4 year price growth rate now stands at 166.83%.
- Its 4 year revenue growth rate is now at -5.91%.
- Its year over year net cashflow from operations growth rate is now at -17.57%.

The table below shows MOH's growth in key financial areas (numbers in millions of US dollars).
Date | Revenue | Operating Cash Flow | Net Income to Common Stock |
---|---|---|---|
2022-12-31 | 31,974 | 773 | 792 |
2022-09-30 | 31,160 | 1,582 | 839 |
2022-06-30 | 30,273 | 1,789 | 752 |
2022-03-31 | 29,019 | 1,914 | 689 |
2021-12-31 | 27,771 | 2,119 | 659 |
2021-09-30 | 25,597 | 2,821 | 590 |
MOH's Quality Factors
The “Quality” component of the POWR Ratings focuses on 31 different factors of a companies fundamentals and operational strength. Here are some key insights as we drill into the specifics of these quality attributes.- MOH has a Quality Grade of B, ranking ahead of 92.88% of graded US stocks.
- MOH's asset turnover comes in at 2.495 -- ranking 2nd of 133 Insurance stocks.
- HUM, ALL, and MMC are the stocks whose asset turnover ratios are most correlated with MOH.
The table below shows MOH's key quality metrics over time.
Period | Asset Turnover | Gross Margin | ROIC |
---|---|---|---|
2021-09-30 | 2.495 | 0.118 | 0.511 |
2021-06-30 | 2.489 | 0.124 | 0.490 |
2021-03-31 | 2.429 | 0.137 | 0.497 |
2020-12-31 | 2.397 | 0.138 | 0.413 |
2020-09-30 | 2.489 | 0.146 | 0.451 |
2020-06-30 | 2.483 | 0.148 | 0.477 |
MOH Price Target
For more insight on analysts targets of MOH, see our MOH price target page. And for a list of of all stocks sorted by upside potential based on analyst target price, see our Top Price Target page.
Average Price Target | $284.33 | Average Broker Recommendation | 1.71 (Moderate Buy) |
Molina Healthcare Inc. (MOH) Company Bio
Molina Healthcare is a managed care company headquartered in Long Beach, California, United States. The company provides health insurance to individuals through government programs such as Medicaid and Medicare. (Source:Wikipedia)
Latest MOH News From Around the Web
Below are the latest news stories about MOLINA HEALTHCARE INC that investors may wish to consider to help them evaluate MOH as an investment opportunity.
Under The Bonnet, Molina Healthcare's (NYSE:MOH) Returns Look ImpressiveDid you know there are some financial metrics that can provide clues of a potential multi-bagger? Amongst other things... |
Why Is Molina (MOH) Down 7.9% Since Last Earnings Report?Molina (MOH) reported earnings 30 days ago. What's next for the stock? We take a look at earnings estimates for some clues. |
If You Invested $1000 in Molina a Decade Ago, This is How Much It'd Be Worth NowHolding on to popular or trending stocks for the long-term can make your portfolio a winner. |
Molina Healthcare Announces Promotions of Two Senior ExecutivesLONG BEACH, Calif., May 16, 2023--Molina Healthcare, Inc. (NYSE: MOH) ("Molina") today announced that Jim Woys and Mark Keim have each been promoted to the position of senior executive vice president, effective May 15th. With this promotion, Woys also assumes the role of chief operating officer. Keim will continue as chief financial officer with expanded operational and growth-related responsibilities. |
Here's Why You Should Hold Molina (MOH) in Your PortfolioMolina's (MOH) inorganic growth activities, financial flexibility and well-performing Medicaid and Medicare segments poise it for growth. |
MOH Price Returns
1-mo | -2.71% |
3-mo | 8.61% |
6-mo | -15.88% |
1-year | -0.39% |
3-year | 67.80% |
5-year | 227.35% |
YTD | -13.09% |
2022 | 3.82% |
2021 | 49.56% |
2020 | 56.74% |
2019 | 16.75% |
2018 | 51.56% |
Continue Researching MOH
Want to do more research on Molina Healthcare Inc's stock and its price? Try the links below:Molina Healthcare Inc (MOH) Stock Price | Nasdaq
Molina Healthcare Inc (MOH) Stock Quote, History and News - Yahoo Finance
Molina Healthcare Inc (MOH) Stock Price and Basic Information | MarketWatch
Loading social stream, please wait...