
Morgan Stanley (MS): Price and Financial Metrics
MS Price/Volume Stats
| Current price | $104.19 | 52-week high | $109.11 |
| Prev. close | $103.56 | 52-week low | $69.42 |
| Day low | $104.04 | Volume | 6,599,600 |
| Day high | $105.89 | Avg. volume | 7,658,935 |
| 50-day MA | $99.65 | Dividend yield | 3.29% |
| 200-day MA | $89.43 | Market Cap | 169.33B |
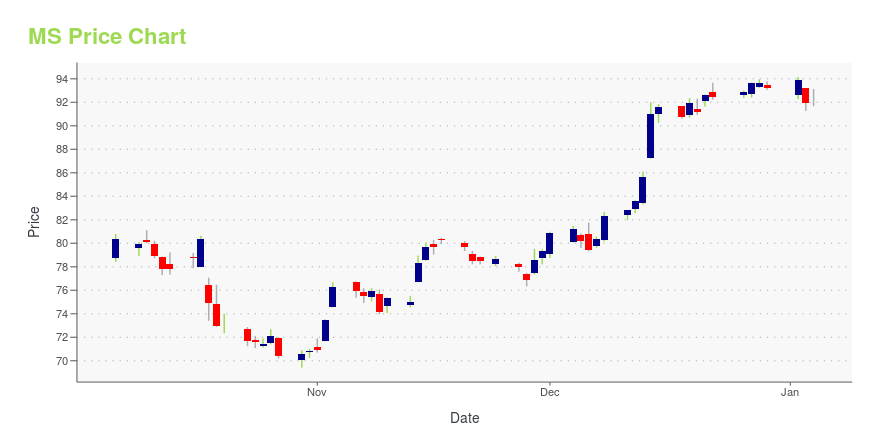
MS Stock Price Chart Interactive Chart >
Morgan Stanley (MS) Company Bio
Morgan Stanley is an American multinational investment bank and financial services company headquartered at 1585 Broadway in the Morgan Stanley Building, Midtown Manhattan, New York City. With offices in more than 42 countries and more than 60,000 employees, the firm's clients include corporations, governments, institutions, and individuals. Morgan Stanley ranked No. 67 in the 2018 Fortune 500 list of the largest United States corporations by total revenue. (Source:Wikipedia)
Latest MS News From Around the Web
Below are the latest news stories about MORGAN STANLEY that investors may wish to consider to help them evaluate MS as an investment opportunity.
3 Stocks to Sell Before 2023 Momentum Cools off CompletelyThe 2024 economy is not looking strong, with a recession imminent. |
4 Analysts Chime in on 2024 Stock Market Price PredictionsWall Street analysts have an average 2024 S&P 500 price price prediction around $5,100. |
The 500 Top Stocks to Buy for 2024, Ranked by AIThese are the very best stocks to buy for 2024 for any investor, according to Tom Yeung's MarketMasterAI system. |
Morgan Stanley, Starbucks, Tesla: 2024 leadership in focusVarious companies have experienced a changing of the guard in leadership in 2023. With 2024 just days away, these companies and fresh CEOs prepare to face new challenges. Three companies in particular are in focus for many investors next year — Morgan Stanley (MS), Starbucks (SBUX), and Tesla (TSLA). Morgan Stanley will have new leadership in CEO Ted Pick, succeeding James Gorman who will stay on as executive chairman for one year. Pick has been with the company since 1990, starting as an analyst and was involved in capital-raising activities during the 2008 financial crisis. Starbucks CEO Laxman Narasimhan will face ongoing challenges in handling growing unionization efforts across Starbucks locations nationwide. Ongoing union pushes and calls for boycotts, which have reportedly cost t... |
Morgan Stanley's straight-talking new CEO Ted Pick taking chargeWhen Ted Pick takes over as the new CEO of Morgan Stanley next week, the three-decade bank veteran's frank manner and steady hand will help him steer the firm through a dealmaking slump. Pick's cool head in difficult situations is an asset, said Tom Glocer, Morgan Stanley's independent lead director since 2017 and former Reuters CEO. "The great sin that gets people into super trouble at banks is the trader's instinct to hold on (to losing positions)... Ted has that ability to be disciplined" and take action, Glocer said. |
MS Price Returns
| 1-mo | 8.79% |
| 3-mo | 13.27% |
| 6-mo | 21.19% |
| 1-year | 17.38% |
| 3-year | 20.55% |
| 5-year | 170.33% |
| YTD | 13.87% |
| 2023 | 13.93% |
| 2022 | -10.34% |
| 2021 | 46.65% |
| 2020 | 38.09% |
| 2019 | 32.67% |
MS Dividends
| Ex-Dividend Date | Type | Payout Amount | Change | ||||||
|---|---|---|---|---|---|---|---|---|---|
| Loading, please wait... | |||||||||
Continue Researching MS
Want to do more research on Morgan Stanley's stock and its price? Try the links below:Morgan Stanley (MS) Stock Price | Nasdaq
Morgan Stanley (MS) Stock Quote, History and News - Yahoo Finance
Morgan Stanley (MS) Stock Price and Basic Information | MarketWatch
Loading social stream, please wait...