
Madison Square Garden Sports Corp. (MSGS): Price and Financial Metrics
MSGS Price/Volume Stats
| Current price | $199.06 | 52-week high | $215.79 |
| Prev. close | $198.12 | 52-week low | $164.79 |
| Day low | $198.49 | Volume | 73,000 |
| Day high | $201.43 | Avg. volume | 119,965 |
| 50-day MA | $190.00 | Dividend yield | N/A |
| 200-day MA | $183.04 | Market Cap | 4.77B |
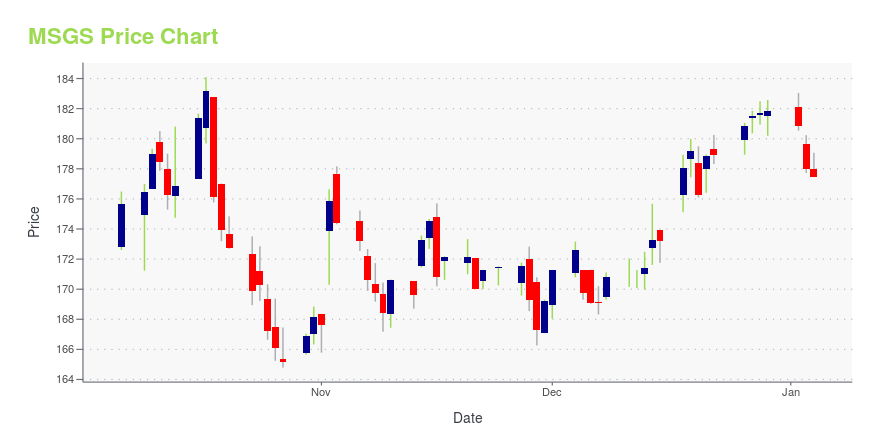
MSGS Stock Price Chart Interactive Chart >
Madison Square Garden Sports Corp. (MSGS) Company Bio
Madison Square Garden Sports Corp. provides entertainment services. The Company arranges various types of programs and events such as musical shows, sports, and theatricals programs. Madison Square Garden Sports serves customers in the State of New York.
Latest MSGS News From Around the Web
Below are the latest news stories about MADISON SQUARE GARDEN SPORTS CORP that investors may wish to consider to help them evaluate MSGS as an investment opportunity.
NEXEN TIRE NAMED OFFICIAL PARTNER OF THE NEW YORK RANGERSMadison Square Garden Sports Corp. (NYSE: MSGS) announced today a marketing partnership with Nexen Tire, naming one of the leading global tire manufacturers an Official Partner of the New York Rangers. Through the partnership, Nexen Tire will receive significant brand promotion during Rangers games at Madison Square Garden, including digital dasherboard signage, virtual blue line signage and ribbon LED signage. Nexen Tire will also receive exposure on the digital boards outside of Madison Square |
Sphere Stock Drops After Earnings. The Company Offered No Guidance.The lack of guidance may have been a factor behind shares hitting their lowest levels since the arena opened. |
MADISON SQUARE GARDEN SPORTS CORP. REPORTS FISCAL 2024 FIRST QUARTER RESULTSMadison Square Garden Sports Corp. (NYSE: MSGS) today reported financial results for the fiscal first quarter ended September 30, 2023. |
Madison Square Garden Sports Corp. to Release Fiscal 2024 First Quarter ResultsMadison Square Garden Sports Corp. (NYSE: MSGS) will issue a press release on Thursday, November 2, 2023 before the market opens reporting results for its fiscal first quarter ended September 30, 2023. |
Sphere Gives CEO Jim Dolan Options Grants Worth $17 MillionThe Sphere arena in Las Vegas recently opened to rave reviews, and the company has awarded its CEO, James Dolan, a potentially valuable special options grant in recognition of his role in the design and execution of the project. Sphere Entertainment (ticker: SPHR) said in a filing earlier this week that it had granted James Dolan 1.2 million stock options with a value of $17.2 million. “The long-term success of expanding the Sphere business, and its transformative venues and productions, is contingent upon our Chief Executive Officer and his team of valuable individuals continuing to lead the effort, and having the Company draw on their unique skills and hands-on, teams-based experience acquired during years of working together,” the company said in its proxy statement. |
MSGS Price Returns
| 1-mo | 5.22% |
| 3-mo | 6.57% |
| 6-mo | 6.65% |
| 1-year | 4.71% |
| 3-year | 20.82% |
| 5-year | -31.21% |
| YTD | 9.48% |
| 2023 | -0.82% |
| 2022 | 5.53% |
| 2021 | -5.63% |
| 2020 | -37.42% |
| 2019 | 9.90% |
Loading social stream, please wait...