
Materialise NV (MTLS): Price and Financial Metrics
MTLS Price/Volume Stats
| Current price | $5.70 | 52-week high | $8.23 |
| Prev. close | $5.88 | 52-week low | $4.70 |
| Day low | $5.59 | Volume | 107,400 |
| Day high | $5.87 | Avg. volume | 75,149 |
| 50-day MA | $5.16 | Dividend yield | N/A |
| 200-day MA | $5.53 | Market Cap | 336.68M |
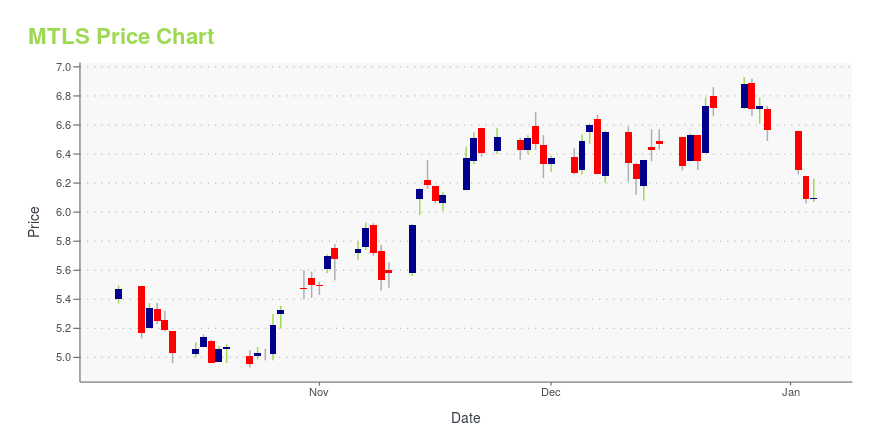
MTLS Stock Price Chart Interactive Chart >
Materialise NV (MTLS) Company Bio
Materialise NV provides additive manufacturing software and 3D printing services in Europe, the Americas, and Asia. The company was founded in 1990 and is based in Leuven, Belgium.
Latest MTLS News From Around the Web
Below are the latest news stories about MATERIALISE NV that investors may wish to consider to help them evaluate MTLS as an investment opportunity.
Materialise (NASDAQ:MTLS) Will Want To Turn Around Its Return TrendsIf we want to find a stock that could multiply over the long term, what are the underlying trends we should look for... |
13 Most Promising Tech Stocks According to AnalystsIn this piece, we will take a look at the 13 most promising tech stocks according to analysts. If you want to skip our coverage of the latest developments in the technology industry, then you can skip the introduction and take a look at the 5 Most Promising Tech Stocks According to Analysts. The technology […] |
Investors in Materialise (NASDAQ:MTLS) have unfortunately lost 86% over the last three yearsMaterialise NV ( NASDAQ:MTLS ) shareholders should be happy to see the share price up 22% in the last month. But that... |
Materialise NV's (NASDAQ:MTLS) Stock Has Shown Weakness Lately But Financial Prospects Look Decent: Is The Market Wrong?Materialise (NASDAQ:MTLS) has had a rough three months with its share price down 20%. However, the company's... |
Materialise NV (NASDAQ:MTLS) Q3 2023 Earnings Call TranscriptMaterialise NV (NASDAQ:MTLS) Q3 2023 Earnings Call Transcript October 26, 2023 Operator: Good day, and thank you for standing by. Welcome to the Q3 2023 Materialise Financial Results Conference Call. [Operator Instructions]. I would now like to hand the call over to our first speaker for today. Let me please introduce Harriet Fried of LHA. […] |
MTLS Price Returns
| 1-mo | 17.04% |
| 3-mo | 8.78% |
| 6-mo | -2.23% |
| 1-year | -28.39% |
| 3-year | -70.54% |
| 5-year | -71.57% |
| YTD | -13.18% |
| 2023 | -25.40% |
| 2022 | -63.13% |
| 2021 | -55.97% |
| 2020 | 196.07% |
| 2019 | -8.59% |
Continue Researching MTLS
Want to do more research on Materialise Nv's stock and its price? Try the links below:Materialise Nv (MTLS) Stock Price | Nasdaq
Materialise Nv (MTLS) Stock Quote, History and News - Yahoo Finance
Materialise Nv (MTLS) Stock Price and Basic Information | MarketWatch
Loading social stream, please wait...