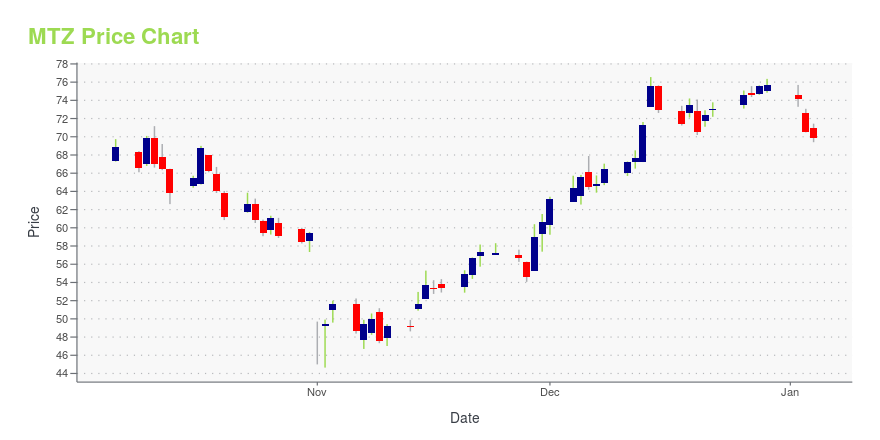
MasTec, Inc. (MTZ): Price and Financial Metrics
MTZ Price/Volume Stats
| Current price | $109.58 | 52-week high | $123.33 |
| Prev. close | $104.98 | 52-week low | $44.65 |
| Day low | $105.43 | Volume | 612,593 |
| Day high | $109.87 | Avg. volume | 864,490 |
| 50-day MA | $107.49 | Dividend yield | N/A |
| 200-day MA | $82.62 | Market Cap | 8.71B |
MTZ Stock Price Chart Interactive Chart >
MasTec, Inc. (MTZ) Company Bio
MasTec Inc. provides engineering, building, installation, maintenance, and upgrade services for energy, utility, and communications infrastructure primarily in the United States. The company was founded in 1929 and is based in Coral Gables, Florida.
Latest MTZ News From Around the Web
Below are the latest news stories about MASTEC INC that investors may wish to consider to help them evaluate MTZ as an investment opportunity.
5 Market-Beating Construction Picks That Might Lose Steam in 2024Despite reducing inflationary pressure and stable interest rates, a few stocks in the construction sector are likely to perform tepidly in 2024. Let's check what is hurting WY, PCH, CHX, MTZ and HLMN. |
MasTec (MTZ) Up 20.4% Since Last Earnings Report: Can It Continue?MasTec (MTZ) reported earnings 30 days ago. What's next for the stock? We take a look at earnings estimates for some clues. |
MasTec Senior Management to Present at the UBS 2023 Industrial Summit Investor ConferenceMasTec, Inc. (NYSE: MTZ) today announced that its senior management will be participating in a fireside chat with our covering analyst at the UBS Industrials Summit Investor Conference on Wednesday, November 29th at approximately 11:00 a.m. Eastern Time. Additionally, one-on-one meetings with institutional investors and MasTec's senior management are also being arranged as a part of the conference. |
Even after rising 12% this past week, MasTec (NYSE:MTZ) shareholders are still down 41% over the past yearMasTec, Inc. ( NYSE:MTZ ) shareholders should be happy to see the share price up 12% in the last week. But that doesn't... |
‘Riding the Clean Energy Wave’: This Analyst Suggests 2 Stocks to Play the Renewable Energy TransitionRegardless of any individual’s feelings about the transition from fossil fuels to renewable energy sources, there’s no doubt that it is happening. Our society has come to the conclusion that fossil fuels are too dirty for continued long-term, large-scale use, and that something will have to replace them. There are plenty of contenders for the role, and prominent among them are renewable power sources such as solar and wind energy. Both of these sources find support from social pressures, which t |
MTZ Price Returns
| 1-mo | 0.86% |
| 3-mo | 23.07% |
| 6-mo | 68.71% |
| 1-year | -6.85% |
| 3-year | 10.53% |
| 5-year | 111.06% |
| YTD | 44.72% |
| 2023 | -11.26% |
| 2022 | -7.53% |
| 2021 | 35.35% |
| 2020 | 6.27% |
| 2019 | 58.19% |
Continue Researching MTZ
Here are a few links from around the web to help you further your research on Mastec Inc's stock as an investment opportunity:Mastec Inc (MTZ) Stock Price | Nasdaq
Mastec Inc (MTZ) Stock Quote, History and News - Yahoo Finance
Mastec Inc (MTZ) Stock Price and Basic Information | MarketWatch


Loading social stream, please wait...