
MYR Group, Inc. (MYRG): Price and Financial Metrics
MYRG Price/Volume Stats
| Current price | $150.09 | 52-week high | $181.02 |
| Prev. close | $143.15 | 52-week low | $110.87 |
| Day low | $145.88 | Volume | 112,492 |
| Day high | $150.61 | Avg. volume | 134,666 |
| 50-day MA | $145.34 | Dividend yield | N/A |
| 200-day MA | $146.19 | Market Cap | 2.52B |
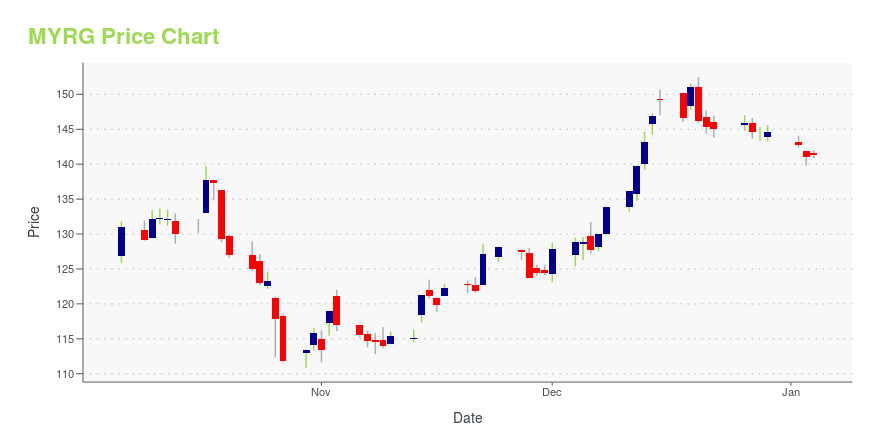
MYRG Stock Price Chart Interactive Chart >
MYR Group, Inc. (MYRG) Company Bio
MYR Group Inc. provides electrical construction services in the United States and Canada. It operates through two segments, Transmission and Distribution, and Commercial and Industrial. The company was founded in 1891 and is based in Rolling Meadows, Illinois.
Latest MYRG News From Around the Web
Below are the latest news stories about MYR GROUP INC that investors may wish to consider to help them evaluate MYRG as an investment opportunity.
Investors Will Want MYR Group's (NASDAQ:MYRG) Growth In ROCE To PersistTo find a multi-bagger stock, what are the underlying trends we should look for in a business? In a perfect world, we'd... |
Is Now The Time To Look At Buying MYR Group Inc. (NASDAQ:MYRG)?MYR Group Inc. ( NASDAQ:MYRG ), is not the largest company out there, but it saw a decent share price growth in the... |
Sidoti Events, LLC's Virtual December Small-Cap ConferenceNEW YORK, NY / ACCESSWIRE / December 5, 2023 / Sidoti Events, LLC, an affiliate of Sidoti & Company, LLC, has released the presentation schedule and weblinks for its two-day December Small-Cap Conference taking place Wednesday and Thursday, December ... |
MYR Group Inc. to Attend Goldman Sachs Energy, CleanTech & Utilities Conference in JanuaryTHORNTON, Colo., Dec. 04, 2023 (GLOBE NEWSWIRE) -- MYR Group Inc. (“MYR Group”) (NASDAQ: MYRG), a holding company of leading specialty contractors serving the electric utility infrastructure, commercial and industrial construction markets in the United States and Canada, announced it will attend the Goldman Sachs Energy, CleanTech & Utilities investor conference. MYR Group’s Chief Executive Officer, Rick Swartz, and Chief Financial Officer, Kelly Huntington, will meet with institutional investor |
MYR Group Inc. (NASDAQ:MYRG) Shares Could Be 49% Below Their Intrinsic Value EstimateKey Insights The projected fair value for MYR Group is US$251 based on 2 Stage Free Cash Flow to Equity MYR Group's... |
MYRG Price Returns
| 1-mo | 10.44% |
| 3-mo | -10.75% |
| 6-mo | 2.63% |
| 1-year | 4.13% |
| 3-year | 61.11% |
| 5-year | 303.58% |
| YTD | 3.78% |
| 2023 | 57.09% |
| 2022 | -16.72% |
| 2021 | 83.94% |
| 2020 | 84.41% |
| 2019 | 15.69% |
Continue Researching MYRG
Want to do more research on Myr Group Inc's stock and its price? Try the links below:Myr Group Inc (MYRG) Stock Price | Nasdaq
Myr Group Inc (MYRG) Stock Quote, History and News - Yahoo Finance
Myr Group Inc (MYRG) Stock Price and Basic Information | MarketWatch
Loading social stream, please wait...