Norwegian Cruise Line Holdings Ltd. (NCLH): Price and Financial Metrics
GET POWR RATINGS... FREE!
NCLH POWR Grades
- NCLH scores best on the Growth dimension, with a Growth rank ahead of 64.86% of US stocks.
- NCLH's strongest trending metric is Growth; it's been moving up over the last 179 days.
- NCLH's current lowest rank is in the Sentiment metric (where it is better than 0.34% of US stocks).
NCLH Stock Summary
- For NCLH, its debt to operating expenses ratio is greater than that reported by 87.88% of US equities we're observing.
- NCLH's price/sales ratio is 13.63; that's higher than the P/S ratio of 89.42% of US stocks.
- As for revenue growth, note that NCLH's revenue has grown -49.37% over the past 12 months; that beats the revenue growth of only 3.28% of US companies in our set.
- Stocks with similar financial metrics, market capitalization, and price volatility to Norwegian Cruise Line Holdings Ltd are SGRY, NRP, BBGI, AM, and SHIP.
- NCLH's SEC filings can be seen here. And to visit Norwegian Cruise Line Holdings Ltd's official web site, go to www.nclhltdinvestor.com.
NCLH Valuation Summary
- In comparison to the median Industrials stock, NCLH's price/earnings ratio is 110.36% lower, now standing at -2.7.
- Over the past 105 months, NCLH's price/sales ratio has gone up 395.5.
- NCLH's price/sales ratio has moved up 395.5 over the prior 105 months.
Below are key valuation metrics over time for NCLH.
Stock | Date | P/S | P/B | P/E | EV/EBIT |
---|---|---|---|---|---|
NCLH | 2021-08-26 | 397.7 | 2.5 | -2.7 | -8.5 |
NCLH | 2021-08-25 | 408.9 | 2.6 | -2.7 | -8.7 |
NCLH | 2021-08-24 | 404.8 | 2.6 | -2.7 | -8.6 |
NCLH | 2021-08-23 | 386.9 | 2.5 | -2.6 | -8.4 |
NCLH | 2021-08-20 | 371.1 | 2.4 | -2.5 | -8.3 |
NCLH | 2021-08-19 | 362.1 | 2.3 | -2.4 | -8.2 |
NCLH Growth Metrics
- Its 2 year net cashflow from operations growth rate is now at -29.92%.
- Its year over year revenue growth rate is now at -99.43%.
- Its 4 year net income to common stockholders growth rate is now at -304.84%.

The table below shows NCLH's growth in key financial areas (numbers in millions of US dollars).
Date | Revenue | Operating Cash Flow | Net Income to Common Stock |
---|---|---|---|
2021-12-31 | 647.986 | -2,468.009 | -4,506.587 |
2021-09-30 | 170.128 | -2,789.968 | -3,672.799 |
2021-06-30 | 23.565 | -2,709.918 | -3,504.28 |
2021-03-31 | 36.126 | -3,355.553 | -3,501.734 |
2020-12-31 | 1,279.908 | -2,556.243 | -4,012.514 |
2020-09-30 | 2,750.947 | -1,576.775 | -3,152.284 |
NCLH's Quality Factors
The “Quality” component of the POWR Ratings focuses on 31 different factors of a companies fundamentals and operational strength. Here are some key insights as we drill into the specifics of these quality attributes.- NCLH has a Quality Grade of D, ranking ahead of 5.08% of graded US stocks.
- NCLH's asset turnover comes in at 0.001 -- ranking 135th of 137 Transportation stocks.
- RCL, LIND, and VTOL are the stocks whose asset turnover ratios are most correlated with NCLH.
The table below shows NCLH's key quality metrics over time.
Period | Asset Turnover | Gross Margin | ROIC |
---|---|---|---|
2021-06-30 | 0.001 | -34.974 | -0.090 |
2021-03-31 | 0.002 | -23.903 | -0.094 |
2020-12-31 | 0.073 | -0.323 | -0.156 |
2020-09-30 | 0.162 | 0.137 | -0.134 |
2020-06-30 | 0.280 | 0.319 | -0.090 |
2020-03-31 | 0.388 | 0.392 | -0.045 |
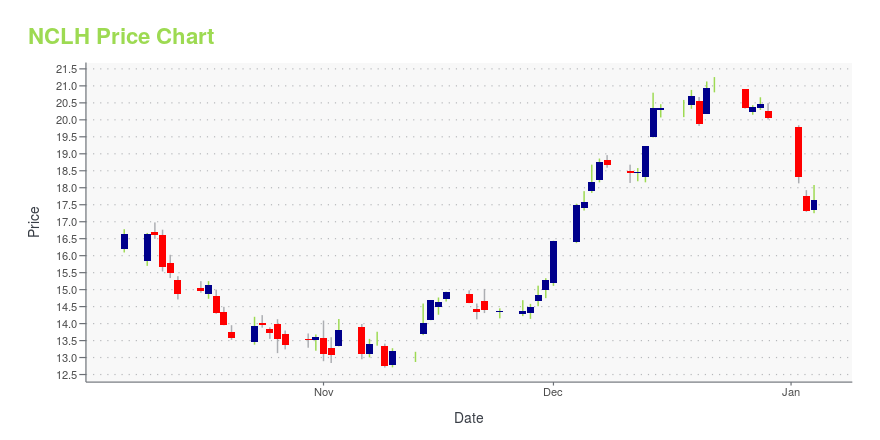
NCLH Stock Price Chart Interactive Chart >
NCLH Price/Volume Stats
Current price | $10.92 | 52-week high | $30.05 |
Prev. close | $11.57 | 52-week low | $10.31 |
Day low | $10.90 | Volume | 1,891,248 |
Day high | $11.31 | Avg. volume | 21,880,639 |
50-day MA | $15.71 | Dividend yield | N/A |
200-day MA | $20.77 | Market Cap | 4.58B |
Norwegian Cruise Line Holdings Ltd. (NCLH) Company Bio
Norwegian Cruise Line Holdings offers cruises under the Norwegian Cruise Line, Oceania Cruises, and Regent Seven Seas Cruises brands. The company was founded in 1966 and is based in Miami, Florida.
Latest NCLH News From Around the Web
Below are the latest news stories about Norwegian Cruise Line Holdings Ltd that investors may wish to consider to help them evaluate NCLH as an investment opportunity.
Norwegian Cruise Line: The Great Cruise ComebackThe cruise lines didn't start the year off on a great footing, but Norwegian Cruise Line Holdings (NCLH) is poised for a big comeback to end 2022. The cruise line is only months away from positive operating cash flows while cash is still burning at a fast clip now. My... |
Norwegian Cruise Line stock sinks on Q4 earnings missNorwegian Cruise Line (NYSE:NCLH) shares have plummeted 7.78% pre-market after the American cruise line reported Q4 earnings and revenue miss and projected a net loss for Q122. It expects to be in loss until regular voyages resume. Q4 revenue increased to $487.4M compared to $9.6M in 2020 as cruise voyages resumed in... |
Norwegian Cruise cancels sailings to Russia, Ukraine ports(Reuters) – Norwegian Cruise Line Holdings Ltd said on Thursday Russia’s invasion of Ukraine has forced it to alter itineraries and cancel sailings to ports in the countries. |
Norwegian Cruise Line Holdings (NCLH) Q4 2021 Earnings Call TranscriptNCLH earnings call for the period ending December 31, 2021. |
Cruise lines scrap St. Petersburg from itineraries after Russia invades UkraineNorwegian Cruise Line and Atlas Ocean Voyages said they are scrapping St. Petersburg from their itineraries after Russia invaded Ukraine. |
NCLH Price Returns
1-mo | -31.79% |
3-mo | -49.95% |
6-mo | -47.35% |
1-year | -62.87% |
3-year | -79.33% |
5-year | -79.89% |
YTD | -47.35% |
2021 | -18.44% |
2020 | -56.46% |
2019 | 37.79% |
2018 | -20.39% |
2017 | 25.21% |
Continue Researching NCLH
Want to see what other sources are saying about Norwegian Cruise Line Holdings Ltd's financials and stock price? Try the links below:Norwegian Cruise Line Holdings Ltd (NCLH) Stock Price | Nasdaq
Norwegian Cruise Line Holdings Ltd (NCLH) Stock Quote, History and News - Yahoo Finance
Norwegian Cruise Line Holdings Ltd (NCLH) Stock Price and Basic Information | MarketWatch
Loading social stream, please wait...