New England Realty Associates Limited Partnership Class A Depositary Receipts Evidencing Units of Limited Partnership (NEN): Price and Financial Metrics
NEN Price/Volume Stats
Current price | $71.25 | 52-week high | $77.36 |
Prev. close | $71.25 | 52-week low | $64.00 |
Day low | $71.25 | Volume | 300 |
Day high | $71.25 | Avg. volume | 544 |
50-day MA | $69.53 | Dividend yield | 2.25% |
200-day MA | $71.31 | Market Cap | 203.42M |
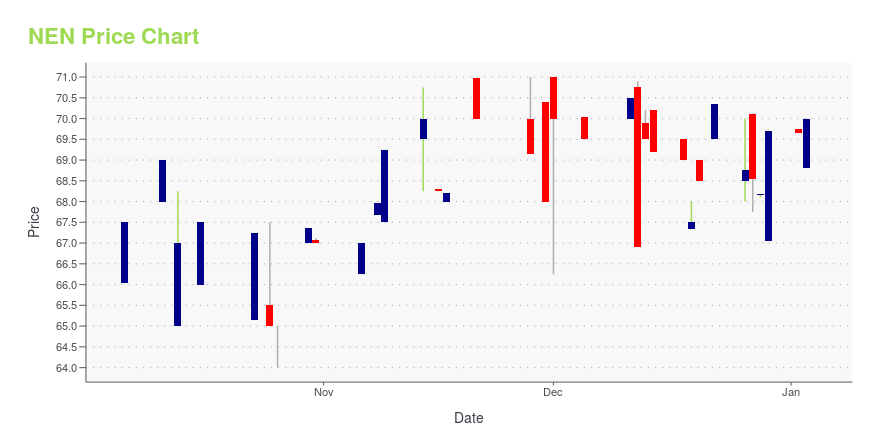
NEN Stock Price Chart Interactive Chart >
NEN Stock Summary
- Of note is the ratio of NEW ENGLAND REALTY ASSOCIATES LIMITED PARTNERSHIP's sales and general administrative expense to its total operating expenses; only 2.46% of US stocks have a lower such ratio.
- Equity multiplier, or assets relative to shareholders' equity, comes in at -6.11 for NEW ENGLAND REALTY ASSOCIATES LIMITED PARTNERSHIP; that's greater than it is for only 3.3% of US stocks.
- In terms of volatility of its share price, NEN is more volatile than merely 0.27% of stocks we're observing.
- Stocks that are quantitatively similar to NEN, based on their financial statements, market capitalization, and price volatility, are CUZ, PDM, SB, ESS, and ALE.
- Visit NEN's SEC page to see the company's official filings. To visit the company's web site, go to www.thehamiltoncompany.com.
NEN Valuation Summary
- NEN's EV/EBIT ratio is 26.5; this is 10.47% lower than that of the median Real Estate stock.
- NEN's EV/EBIT ratio has moved up 12.4 over the prior 243 months.
Below are key valuation metrics over time for NEN.
Stock | Date | P/S | P/B | P/E | EV/EBIT |
---|---|---|---|---|---|
NEN | 2023-12-29 | 3.4 | -3.8 | 29.4 | 26.5 |
NEN | 2023-12-28 | 3.3 | -3.7 | 28.8 | 26.3 |
NEN | 2023-12-27 | 3.3 | -3.7 | 29.0 | 26.3 |
NEN | 2023-12-26 | 3.3 | -3.7 | 29.0 | 26.3 |
NEN | 2023-12-22 | 3.4 | -3.8 | 29.7 | 26.6 |
NEN | 2023-12-21 | 3.3 | -3.7 | 28.9 | 26.3 |
NEN Growth Metrics
- Its 4 year net cashflow from operations growth rate is now at 35.44%.
- Its year over year net income to common stockholders growth rate is now at -765.46%.
- Its 2 year net income to common stockholders growth rate is now at -132.17%.
The table below shows NEN's growth in key financial areas (numbers in millions of US dollars).
Date | Revenue | Operating Cash Flow | Net Income to Common Stock |
---|---|---|---|
2022-09-30 | 66.74637 | 15.96813 | -1.319862 |
2022-06-30 | 65.61466 | 14.06647 | -2.390471 |
2022-03-31 | 64.13007 | 16.02116 | -2.063565 |
2021-12-31 | 62.63845 | 15.78316 | -2.700163 |
2021-09-30 | 61.30856 | 16.9961 | -0.769697 |
2021-06-30 | 60.50415 | 17.09641 | -1.133596 |
New England Realty Associates Limited Partnership Class A Depositary Receipts Evidencing Units of Limited Partnership (NEN) Company Bio
New England Realty Associates Limited Partnership engages in acquiring, developing, holding for investment, operating, and selling real estate properties in the United States. It owns and operates various residential apartment buildings, condominium units, and commercial properties located in Massachusetts and New Hampshire. The company was founded in 1977 and is based in Allston, Massachusetts.
Latest NEN News From Around the Web
Below are the latest news stories about NEW ENGLAND REALTY ASSOCIATES LIMITED PARTNERSHIP that investors may wish to consider to help them evaluate NEN as an investment opportunity.
New England Realty Associates (NYSE American: NEN) Receives Notice of Noncompliance with NYSE American Continued Listing StandardsNew England Realty Associates Limited Partnership (the "Partnership") today announced that on November 15, 2022, it received a notification letter from the Corporate Compliance Department of the NYSE American Exchange (the "NYSE American") indicating that as of November 15, 2022, the Partnership is not in compliance with the NYSE American's standards for continued listing of the Partnership's Depositary Receipts on the NYSE American as set forth in Section 1007 of the NYSE American Company Guide |
NEN Price Returns
1-mo | 1.06% |
3-mo | 4.01% |
6-mo | N/A |
1-year | -0.73% |
3-year | 40.46% |
5-year | 23.51% |
YTD | 2.22% |
2023 | 2.09% |
2022 | 8.24% |
2021 | 38.06% |
2020 | -17.02% |
2019 | 13.14% |
NEN Dividends
Ex-Dividend Date | Type | Payout Amount | Change | ||||||
---|---|---|---|---|---|---|---|---|---|
Loading, please wait... |
Continue Researching NEN
Want to do more research on New England Realty Associates Limited Partnership's stock and its price? Try the links below:New England Realty Associates Limited Partnership (NEN) Stock Price | Nasdaq
New England Realty Associates Limited Partnership (NEN) Stock Quote, History and News - Yahoo Finance
New England Realty Associates Limited Partnership (NEN) Stock Price and Basic Information | MarketWatch
Loading social stream, please wait...