NextEra Energy Partners, LP Common Units representing limited partner interests (NEP): Price and Financial Metrics
NEP Price/Volume Stats
Current price | $29.00 | 52-week high | $64.43 |
Prev. close | $27.91 | 52-week low | $20.17 |
Day low | $28.10 | Volume | 1,569,100 |
Day high | $29.25 | Avg. volume | 1,402,640 |
50-day MA | $28.23 | Dividend yield | 12.46% |
200-day MA | $36.74 | Market Cap | 2.71B |
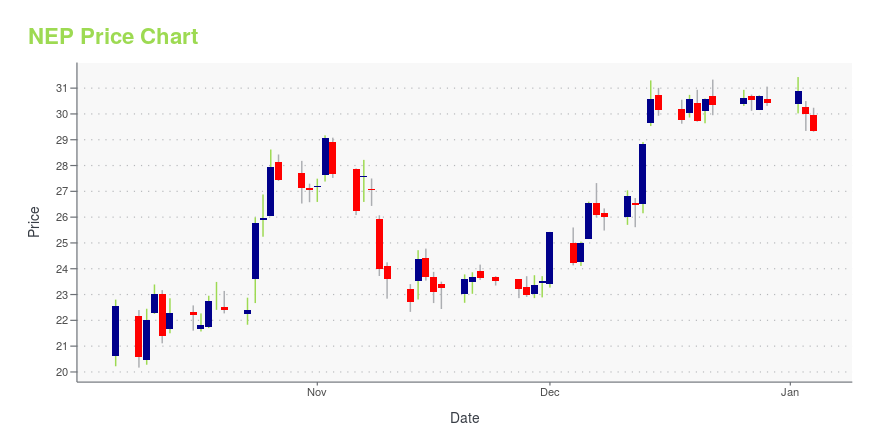
NEP Stock Price Chart Interactive Chart >
NEP POWR Grades
- Quality is the dimension where NEP ranks best; there it ranks ahead of 41.92% of US stocks.
- The strongest trend for NEP is in Growth, which has been heading up over the past 26 weeks.
- NEP's current lowest rank is in the Value metric (where it is better than 4.31% of US stocks).
NEP Stock Summary
- Of note is the ratio of NEXTERA ENERGY PARTNERS LP's sales and general administrative expense to its total operating expenses; only 0.17% of US stocks have a lower such ratio.
- For NEP, its debt to operating expenses ratio is greater than that reported by 94.07% of US equities we're observing.
- In terms of twelve month growth in earnings before interest and taxes, NEXTERA ENERGY PARTNERS LP is reporting a growth rate of -326%; that's higher than merely 3.97% of US stocks.
- Stocks that are quantitatively similar to NEP, based on their financial statements, market capitalization, and price volatility, are NWN, IDA, MGEE, CMS, and UTL.
- Visit NEP's SEC page to see the company's official filings. To visit the company's web site, go to www.investor.nexteraenergypartners.com.
NEP Valuation Summary
- NEP's price/sales ratio is 2.2; this is 22.22% higher than that of the median Utilities stock.
- NEP's price/sales ratio has moved down 1.5 over the prior 116 months.
Below are key valuation metrics over time for NEP.
Stock | Date | P/S | P/B | P/E | EV/EBIT |
---|---|---|---|---|---|
NEP | 2023-12-27 | 2.2 | 0.8 | 23.4 | 26.6 |
NEP | 2023-12-26 | 2.2 | 0.8 | 23.4 | 26.6 |
NEP | 2023-12-22 | 2.2 | 0.8 | 23.2 | 26.5 |
NEP | 2023-12-21 | 2.2 | 0.8 | 23.4 | 26.6 |
NEP | 2023-12-20 | 2.2 | 0.8 | 22.8 | 26.3 |
NEP | 2023-12-19 | 2.2 | 0.8 | 23.4 | 26.6 |
NEP Growth Metrics
- The year over year cash and equivalents growth rate now stands at 52.73%.
- Its 2 year revenue growth rate is now at 14.27%.
- Its 5 year net cashflow from operations growth rate is now at 35.67%.
The table below shows NEP's growth in key financial areas (numbers in millions of US dollars).
Date | Revenue | Operating Cash Flow | Net Income to Common Stock |
---|---|---|---|
2022-12-31 | 1,211 | 776 | 477 |
2022-09-30 | 1,176 | 796 | 433 |
2022-06-30 | 1,126 | 778 | 372 |
2022-03-31 | 1,017 | 693 | 79 |
2021-12-31 | 982 | 677 | 137 |
2021-09-30 | 963 | 675 | 210 |
NEP's Quality Factors
The “Quality” component of the POWR Ratings focuses on 31 different factors of a companies fundamentals and operational strength. Here are some key insights as we drill into the specifics of these quality attributes.- NEP has a Quality Grade of B, ranking ahead of 77.68% of graded US stocks.
- NEP's asset turnover comes in at 0.074 -- ranking 100th of 105 Utilities stocks.
- PCG, SJW, and ARTNA are the stocks whose asset turnover ratios are most correlated with NEP.
The table below shows NEP's key quality metrics over time.
Period | Asset Turnover | Gross Margin | ROIC |
---|---|---|---|
2021-09-30 | 0.074 | 0.557 | 0.002 |
2021-06-30 | 0.075 | 0.565 | -0.002 |
2021-03-31 | 0.076 | 0.581 | -0.017 |
2020-12-31 | 0.074 | 0.571 | 0.042 |
2020-09-30 | 0.074 | 0.566 | 0.045 |
2020-06-30 | 0.076 | 0.580 | 0.069 |
NextEra Energy Partners, LP Common Units representing limited partner interests (NEP) Company Bio
NextEra Energy Partners LP acquires, owns, and operates contracted clean energy projects. It owns interests in wind and solar projects in North America. The company was founded in 2014 and is based in Juno Beach, Florida.
Latest NEP News From Around the Web
Below are the latest news stories about NEXTERA ENERGY PARTNERS LP that investors may wish to consider to help them evaluate NEP as an investment opportunity.
NextEra Energy Partners, LP completes sale of Texas natural gas pipeline portfolioNextEra Energy Partners, LP (NYSE: NEP) today announced it has closed on its previously disclosed agreement with Kinder Morgan, Inc. (NYSE: KMI) to sell its Texas natural gas pipeline portfolio for $1.815 billion. |
3 Top Dividend Aristocrats to Buy Ahead of 2024Some of the dividend aristocrats, such as Cardinal Health (CAH), Atmos Energy (ATO) and NextEra Energy (NEE), have a better-quality business and strong underlying fundamentals. |
PNM Resources (PNM) to Sell Renewable Joint Venture for $230MPNM Resources (PNM) and American Electric Power inked a deal to divest around 50% stake each in New Mexico Renewable Development, LLC for $230 million. |
Here's Why NextEra Energy Is a No-Brainer Dividend Growth StockNextEra Energy has a great dividend record, and there's no reason to think it won't keep its payout growth streak alive and strong. |
NextEra Energy (NEE) Outpaces Stock Market Gains: What You Should KnowIn the most recent trading session, NextEra Energy (NEE) closed at $60.58, indicating a +0.61% shift from the previous trading day. |
NEP Price Returns
1-mo | 6.23% |
3-mo | -1.78% |
6-mo | 3.66% |
1-year | -47.84% |
3-year | -51.47% |
5-year | -20.55% |
YTD | -1.78% |
2023 | -53.32% |
2022 | -13.52% |
2021 | 30.01% |
2020 | 32.40% |
2019 | 27.53% |
NEP Dividends
Ex-Dividend Date | Type | Payout Amount | Change | ||||||
---|---|---|---|---|---|---|---|---|---|
Loading, please wait... |
Continue Researching NEP
Want to see what other sources are saying about NextEra Energy Partners LP's financials and stock price? Try the links below:NextEra Energy Partners LP (NEP) Stock Price | Nasdaq
NextEra Energy Partners LP (NEP) Stock Quote, History and News - Yahoo Finance
NextEra Energy Partners LP (NEP) Stock Price and Basic Information | MarketWatch
Loading social stream, please wait...