NextEra Energy Partners, LP Common Units representing limited partner interests (NEP): Price and Financial Metrics
NEP Price/Volume Stats
Current price | $62.00 | 52-week high | $86.06 |
Prev. close | $62.01 | 52-week low | $51.58 |
Day low | $61.67 | Volume | 468,900 |
Day high | $62.85 | Avg. volume | 936,016 |
50-day MA | $59.96 | Dividend yield | 5.49% |
200-day MA | $70.58 | Market Cap | 5.51B |
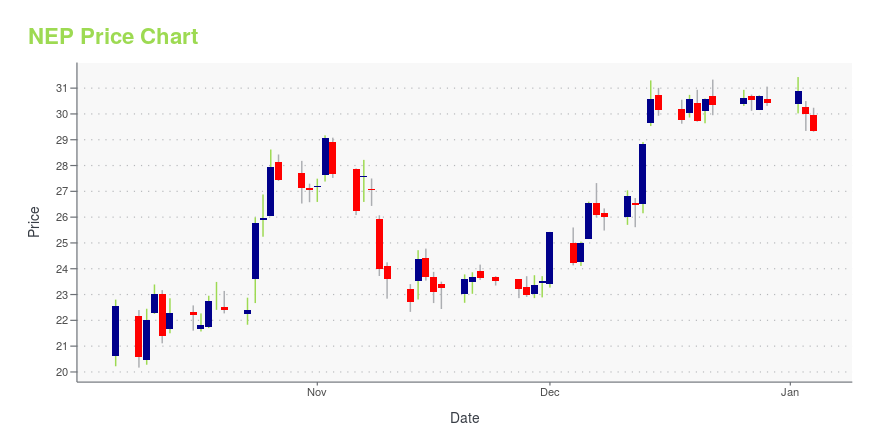
NEP Stock Price Chart Interactive Chart >
NEP POWR Grades
- NEP scores best on the Momentum dimension, with a Momentum rank ahead of 70.99% of US stocks.
- NEP's strongest trending metric is Growth; it's been moving down over the last 179 days.
- NEP's current lowest rank is in the Growth metric (where it is better than 2.07% of US stocks).
NEP Stock Summary
- Of note is the ratio of NEXTERA ENERGY PARTNERS LP's sales and general administrative expense to its total operating expenses; just 0.35% of US stocks have a lower such ratio.
- The ratio of debt to operating expenses for NEXTERA ENERGY PARTNERS LP is higher than it is for about 94.22% of US stocks.
- Equity multiplier, or assets relative to shareholders' equity, comes in at 6.19 for NEXTERA ENERGY PARTNERS LP; that's greater than it is for 82.89% of US stocks.
- Stocks that are quantitatively similar to NEP, based on their financial statements, market capitalization, and price volatility, are OBE, FTS, EBR, X, and BITF.
- NEP's SEC filings can be seen here. And to visit NEXTERA ENERGY PARTNERS LP's official web site, go to www.investor.nexteraenergypartners.com.
NEP Valuation Summary
- NEP's EV/EBIT ratio is 226.1; this is 927.73% higher than that of the median Utilities stock.
- Over the past 108 months, NEP's price/sales ratio has gone up 0.6.
Below are key valuation metrics over time for NEP.
Stock | Date | P/S | P/B | P/E | EV/EBIT |
---|---|---|---|---|---|
NEP | 2023-05-17 | 4.3 | 1.6 | 16.6 | 226.1 |
NEP | 2023-05-16 | 4.4 | 1.6 | 16.9 | 227.5 |
NEP | 2023-05-15 | 4.5 | 1.6 | 17.3 | 230.5 |
NEP | 2023-05-12 | 4.5 | 1.6 | 17.4 | 231.4 |
NEP | 2023-05-11 | 4.4 | 1.6 | 17.0 | 228.7 |
NEP | 2023-05-10 | 4.4 | 1.6 | 17.1 | 229.5 |
NEP Growth Metrics
- The year over year cash and equivalents growth rate now stands at 52.73%.
- Its 2 year revenue growth rate is now at 14.27%.
- Its 5 year net cashflow from operations growth rate is now at 35.67%.

The table below shows NEP's growth in key financial areas (numbers in millions of US dollars).
Date | Revenue | Operating Cash Flow | Net Income to Common Stock |
---|---|---|---|
2022-12-31 | 1,211 | 776 | 477 |
2022-09-30 | 1,176 | 796 | 433 |
2022-06-30 | 1,126 | 778 | 372 |
2022-03-31 | 1,017 | 693 | 79 |
2021-12-31 | 982 | 677 | 137 |
2021-09-30 | 963 | 675 | 210 |
NEP's Quality Factors
The “Quality” component of the POWR Ratings focuses on 31 different factors of a companies fundamentals and operational strength. Here are some key insights as we drill into the specifics of these quality attributes.- NEP has a Quality Grade of B, ranking ahead of 77.68% of graded US stocks.
- NEP's asset turnover comes in at 0.074 -- ranking 100th of 105 Utilities stocks.
- PCG, SJW, and ARTNA are the stocks whose asset turnover ratios are most correlated with NEP.
The table below shows NEP's key quality metrics over time.
Period | Asset Turnover | Gross Margin | ROIC |
---|---|---|---|
2021-09-30 | 0.074 | 0.557 | 0.002 |
2021-06-30 | 0.075 | 0.565 | -0.002 |
2021-03-31 | 0.076 | 0.581 | -0.017 |
2020-12-31 | 0.074 | 0.571 | 0.042 |
2020-09-30 | 0.074 | 0.566 | 0.045 |
2020-06-30 | 0.076 | 0.580 | 0.069 |
NextEra Energy Partners, LP Common Units representing limited partner interests (NEP) Company Bio
NextEra Energy Partners LP acquires, owns, and operates contracted clean energy projects. It owns interests in wind and solar projects in North America. The company was founded in 2014 and is based in Juno Beach, Florida.
Latest NEP News From Around the Web
Below are the latest news stories about NEXTERA ENERGY PARTNERS LP that investors may wish to consider to help them evaluate NEP as an investment opportunity.
NextEra Energy (NEE) Dips More Than Broader Markets: What You Should KnowIn the latest trading session, NextEra Energy (NEE) closed at $73.59, marking a -0.35% move from the previous day. |
S&P 500 Dividend Aristocrats List: Sorted By Hedge Fund PopularityIn this article, we will discuss the best dividend aristocrat stocks sorted by hedge fund popularity. You can skip our detailed analysis of dividend aristocrats and their past performance, and go directly to read S&P 500 Dividend Aristocrats List: Top 10 Among Hedge Funds. Dividend aristocrats are companies in the S&P 500 that have a […] |
2 Great Large Cap Stocks to Buy On Sale in JuneHere are two stocks that have more than doubled the S&P 500 over the past 20 years that boast proven business models that should thrive for years to come. Both stocks are also trading at prices and valuations that make them potentially attractive long-term buys right now. |
The Zacks Analyst Blog Highlights Fomento Economico Mexicano, NextEra Energy, Sanofi, NVIDIA and EnbridgeFomento Economico Mexicano, NextEra Energy, Sanofi, NVIDIA and Enbridge are included in this Analyst Blog. |
Top Stock Reports for FEMSA, NextEra Energy & SanofiToday's Research Daily features new research reports on 16 major stocks, including Fomento Economico Mexicano, S.A.B. de C.V. (FMX), NextEra Energy, Inc. (NEE) and Sanofi (SNY). |
NEP Price Returns
1-mo | 2.48% |
3-mo | -3.01% |
6-mo | -14.56% |
1-year | -15.80% |
3-year | 33.01% |
5-year | 71.88% |
YTD | -9.15% |
2022 | -13.52% |
2021 | 30.01% |
2020 | 32.40% |
2019 | 27.53% |
2018 | 3.74% |
NEP Dividends
Ex-Dividend Date | Type | Payout Amount | Change | ||||||
---|---|---|---|---|---|---|---|---|---|
Loading, please wait... |
Continue Researching NEP
Want to see what other sources are saying about NextEra Energy Partners LP's financials and stock price? Try the links below:NextEra Energy Partners LP (NEP) Stock Price | Nasdaq
NextEra Energy Partners LP (NEP) Stock Quote, History and News - Yahoo Finance
NextEra Energy Partners LP (NEP) Stock Price and Basic Information | MarketWatch
Loading social stream, please wait...