
Neptune Wellness Solutions Inc. (NEPT): Price and Financial Metrics
NEPT Price/Volume Stats
| Current price | $0.20 | 52-week high | $28.00 |
| Prev. close | $0.37 | 52-week low | $0.19 |
| Day low | $0.19 | Volume | 2,254,300 |
| Day high | $0.27 | Avg. volume | 462,687 |
| 50-day MA | $0.46 | Dividend yield | N/A |
| 200-day MA | $3.09 | Market Cap | 906.40K |
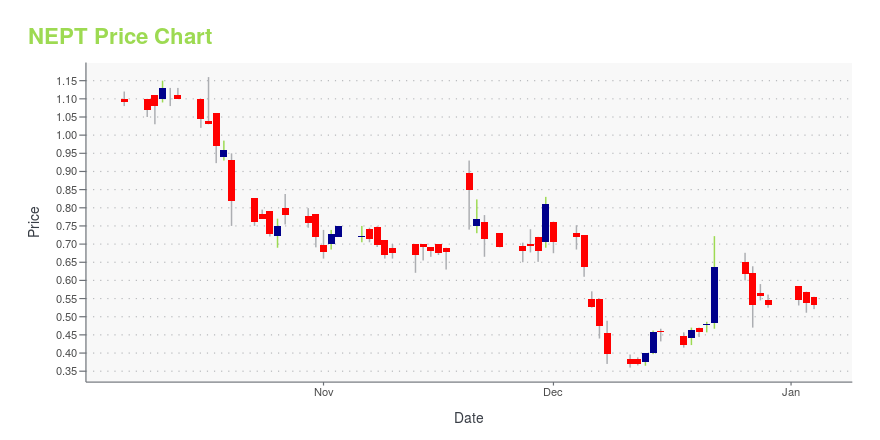
NEPT Stock Price Chart Interactive Chart >
Neptune Wellness Solutions Inc. (NEPT) Company Bio
Neptune Wellness Solutions Inc. is a diversified and fully integrated health and wellness company. The Company focuses on building a broad portfolio of affordable consumer products in response to long-term secular trends and market demand for natural, plant-based, sustainable, and purpose-driven lifestyle brands.
Latest NEPT News From Around the Web
Below are the latest news stories about NEPTUNE WELLNESS SOLUTIONS INC that investors may wish to consider to help them evaluate NEPT as an investment opportunity.
Today’s Biggest Pre-Market Stock Movers: 10 Top Gainers and Losers on ThursdayIt's time to start the day off right with a look at the biggest pre-market stock movers to watch for Thursday morning! |
Neptune Wellness Announces Receipt of Nasdaq Delisting Notice and Intention to AppealLAVAL, QC / ACCESSWIRE / December 4, 2023 / Neptune Wellness Solutions Inc. ("Neptune" or the "Company") (NASDAQ:NEPT), a consumer-packaged goods company focused on plant-based, sustainable and purpose-driven lifestyle brands, today announced that ... |
Neptune Wellness Nutraceutical Brand, Biodroga, Announces Accounts Receivable Factoring Facility of Up to $8 MillionNeptune Wellness Solutions Inc. ("Neptune" or the "Company") (NASDAQ: NEPT), a consumer-packaged goods company focused on plant-based, sustainable and purpose-driven lifestyle brands, today announced that its nutraceuticals brand subsidiary, Biodroga Nutraceuticals Inc. ("Biodroga"), has entered into an accounts receivable factoring facility and inventory finance rider (collectively, the "Facility") with Alterna Capital Solutions, LLC ("Alterna"). The amount available under the Facility at any g |
Neptune Wellness Announces Letter of Intent to Acquire Leading Data-Marketing and Artificial Intelligence Company, Datasys, for Total Potential Consideration of $112 MillionNeptune Wellness Solutions Inc. ("Neptune" or the "Company") (NASDAQ: NEPT), a consumer-packaged goods company focused on plant-based, sustainable and purpose-driven lifestyle brands, today announced it has entered into a non-binding Letter of Intent ("LOI") to acquire Datasys Group, Inc., ("Datasys") and affiliated companies. The non-binding LOI establishes the framework for a potential transaction (the "Proposed Transaction") whereby Neptune would acquire all the outstanding equity of Datasys, |
Neptune Reports Fiscal Second Quarter 2024 Financial ResultsNeptune Wellness Solutions Inc. ("Neptune" or the "Company") (NASDAQ: NEPT), a consumer-packaged goods company focused on plant-based, sustainable and purpose-driven lifestyle brands, today announced its financial and operating results for the three-month period ending September 30, 2023. |
NEPT Price Returns
| 1-mo | N/A |
| 3-mo | N/A |
| 6-mo | -57.95% |
| 1-year | -95.99% |
| 3-year | -99.98% |
| 5-year | -100.00% |
| YTD | -62.43% |
| 2023 | -95.78% |
| 2022 | -97.80% |
| 2021 | -73.72% |
| 2020 | -43.27% |
| 2019 | 8.27% |
Continue Researching NEPT
Want to see what other sources are saying about Neptune Wellness Solutions Inc's financials and stock price? Try the links below:Neptune Wellness Solutions Inc (NEPT) Stock Price | Nasdaq
Neptune Wellness Solutions Inc (NEPT) Stock Quote, History and News - Yahoo Finance
Neptune Wellness Solutions Inc (NEPT) Stock Price and Basic Information | MarketWatch
Loading social stream, please wait...