NeuroBo Pharmaceuticals Inc. (NRBO): Price and Financial Metrics
NRBO Price/Volume Stats
| Current price | $2.36 | 52-week high | $6.75 |
| Prev. close | $2.35 | 52-week low | $2.08 |
| Day low | $2.32 | Volume | 13,000 |
| Day high | $2.44 | Avg. volume | 397,830 |
| 50-day MA | $2.73 | Dividend yield | N/A |
| 200-day MA | $3.81 | Market Cap | 20.33M |
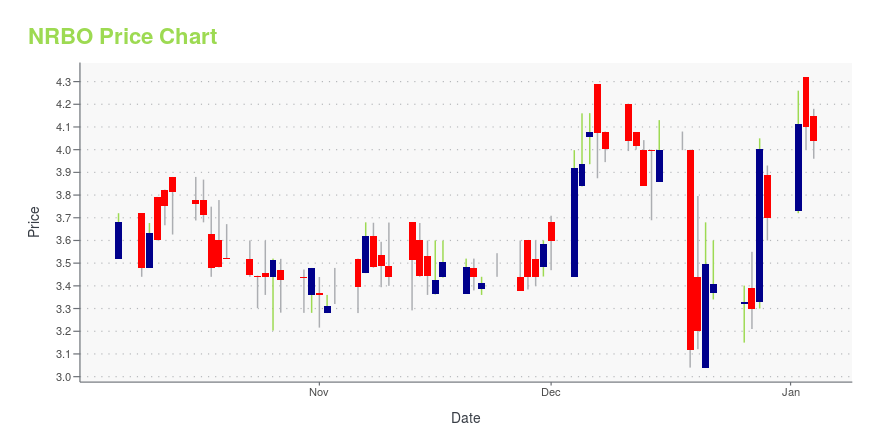
NRBO Stock Price Chart Interactive Chart >
NeuroBo Pharmaceuticals Inc. (NRBO) Company Bio
NeuroBo Pharmaceuticals Inc. operates as a clinical-stage biopharmaceutical company. The Company focuses on developing and commercializing therapies for the treatment of dyslipidemia. NeuroBo Pharmaceuticals conducts business in the United States.
NRBO Price Returns
| 1-mo | N/A |
| 3-mo | N/A |
| 6-mo | N/A |
| 1-year | -51.24% |
| 3-year | 391.87% |
| 5-year | -70.68% |
| YTD | N/A |
| 2024 | 0.00% |
| 2023 | 415.21% |
| 2022 | -41.19% |
| 2021 | -76.76% |
| 2020 | -40.00% |


Loading social stream, please wait...