
NV5 Global, Inc. (NVEE): Price and Financial Metrics
NVEE Price/Volume Stats
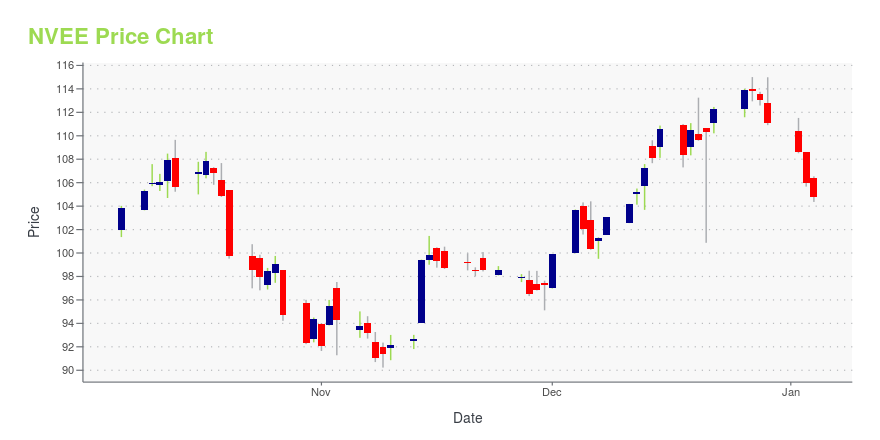
| Current price | $103.63 | 52-week high | $115.01 |
| Prev. close | $102.75 | 52-week low | $88.26 |
| Day low | $102.18 | Volume | 51,400 |
| Day high | $104.23 | Avg. volume | 76,580 |
| 50-day MA | $94.32 | Dividend yield | N/A |
| 200-day MA | $99.24 | Market Cap | 1.67B |
NVEE Stock Price Chart Interactive Chart >
NV5 Global, Inc. (NVEE) Company Bio
NV5 Holdings is a provider of professional and technical engineering and consulting solutions to public and private sector clients in the infrastructure, energy, construction, real estate and environmental markets. The company was founded in 1949 and is based in Hollywood, Florida.
Latest NVEE News From Around the Web
Below are the latest news stories about NV5 GLOBAL INC that investors may wish to consider to help them evaluate NVEE as an investment opportunity.
NV5 Awarded $7 Million in Contracts to Support Building Safety and Engineering Plan Review in CaliforniaHOLLYWOOD, Fla., Dec. 14, 2023 (GLOBE NEWSWIRE) -- NV5 Global, Inc. (the “Company” or “NV5”) (Nasdaq: NVEE), a provider of technology, conformity assessment, and consulting solutions, announced today that it has been awarded contracts totaling $7 million to support two California counties through engineering plan review services. NV5 was awarded a $5 million contract by the County of San Diego to support the Building Services Division through plan check services for residential, commercial, and |
NV5 Awarded $9 Million Geospatial Vegetation Management Contract by Northern California UtilityHOLLYWOOD, Fla., Dec. 12, 2023 (GLOBE NEWSWIRE) -- NV5 Global, Inc. (the “Company” or “NV5”) (Nasdaq: NVEE), a provider of technology, conformity assessment, and consulting solutions, announced today that it has been awarded a one-year, $9 million contract by a Northern California utility for vegetation management designed to minimize vegetation encroachment on the utility’s transmission system. During the initial phase of the project, NV5 will utilize advanced remote sensing technologies to ide |
Are Investors Undervaluing NV5 Global, Inc. (NASDAQ:NVEE) By 50%?Key Insights NV5 Global's estimated fair value is US$202 based on 2 Stage Free Cash Flow to Equity Current share price... |
Can Financials Drive NV5 Global, Inc.'s (NASDAQ:NVEE) Stock Price Higher?Looking at NV5 Global's (NASDAQ:NVEE) mostly flat share price movement over the past week, it is easy to think that... |
NV5 Awarded $17 Million in New Jersey Utilities ContractsHOLLYWOOD, Fla., Nov. 20, 2023 (GLOBE NEWSWIRE) -- NV5 Global, Inc. (the “Company” or “NV5”) (Nasdaq: NVEE), a provider of technology, conformity assessment, and consulting solutions, announced today that it been awarded $17 million in contracts to support utility projects in New Jersey. NV5 has been awarded a two-year, $12 million contract by a New Jersey gas utility to provide comprehensive design, procurement, and construction inspection services on various improvement projects. NV5 will deli |
NVEE Price Returns
| 1-mo | 12.85% |
| 3-mo | 10.27% |
| 6-mo | -3.64% |
| 1-year | -5.32% |
| 3-year | 12.57% |
| 5-year | 26.30% |
| YTD | -6.74% |
| 2023 | -16.02% |
| 2022 | -4.20% |
| 2021 | 75.32% |
| 2020 | 56.15% |
| 2019 | -16.68% |
Continue Researching NVEE
Here are a few links from around the web to help you further your research on NV5 Global Inc's stock as an investment opportunity:NV5 Global Inc (NVEE) Stock Price | Nasdaq
NV5 Global Inc (NVEE) Stock Quote, History and News - Yahoo Finance
NV5 Global Inc (NVEE) Stock Price and Basic Information | MarketWatch
Loading social stream, please wait...