
NexPoint Residential Trust, Inc. (NXRT): Price and Financial Metrics
NXRT Price/Volume Stats
| Current price | $43.31 | 52-week high | $43.72 |
| Prev. close | $42.58 | 52-week low | $26.21 |
| Day low | $42.80 | Volume | 101,199 |
| Day high | $43.72 | Avg. volume | 149,383 |
| 50-day MA | $38.45 | Dividend yield | 4.32% |
| 200-day MA | $33.29 | Market Cap | 1.11B |
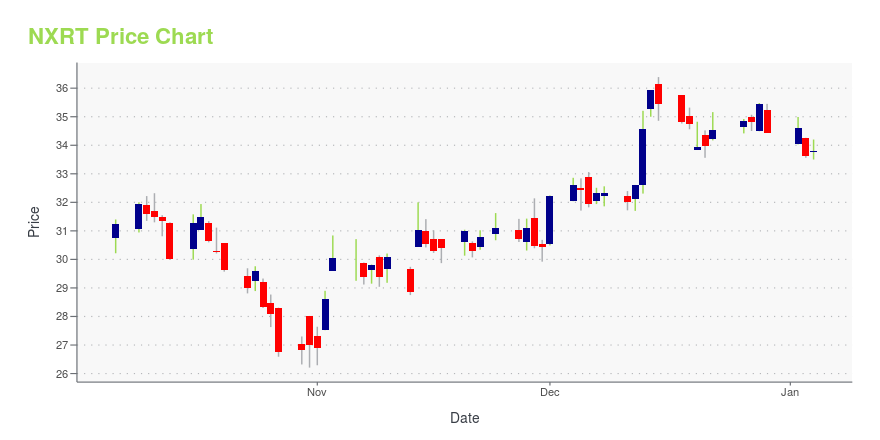
NXRT Stock Price Chart Interactive Chart >
NexPoint Residential Trust, Inc. (NXRT) Company Bio
NexPoint Residential Trust, Inc. is a real estate investment trust. The Company is focused on directly or indirectly acquiring, owning, operating and selectively developing Class A and B multifamily properties in large cities and suburban submarkets of large cities, in the Southeastern United States and Texas. The firm is based in Dallas, Texas.
Latest NXRT News From Around the Web
Below are the latest news stories about NEXPOINT RESIDENTIAL TRUST INC that investors may wish to consider to help them evaluate NXRT as an investment opportunity.
Rental Revolution: 3 Stocks to Ride Housing’s Newest TrendThe rental market trends bode well for companies focused on rental housing. |
NexPoint Residential Trust, Inc. to Participate at Nareit's REITworld: 2023 Annual ConferenceNexPoint Residential Trust, Inc. ("NXRT" or the "Company") (NYSE: NXRT) announced today that Brian Mitts, NXRT's Chief Financial Officer, Executive VP-Finance, Secretary and Treasurer, Matthew McGraner, NXRT's Executive VP and Chief Investment Officer, Bonner McDermett, NXRT VP, Asset Management, and Sean Jacobson, NXRT VP, Asset Management will be meeting with investors and others at Nareit's REITworld: 2023 Annual Conference, to be held November 14-16 at the JW Marriott LA Live in Los Angeles. |
NEXPOINT RESIDENTIAL TRUST, INC. REPORTS THIRD QUARTER 2023 RESULTSNexPoint Residential Trust, Inc. (NYSE:NXRT) reported financial results for the third quarter ended September 30, 2023. |
NexPoint Residential Trust, Inc. Increases Quarterly Dividend by 10.1%NexPoint Residential Trust, Inc. (NYSE: NXRT) ("NXRT") announced today that its board of directors unanimously approved a dividend of $0.46242 per share of NXRT common stock, payable on December 29, 2023, to stockholders of record on December 15, 2023. This represents a 10.1% increase over the previous quarter's distribution and an increase of 124.5% since inception in 2015. |
Down -15.91% in 4 Weeks, Here's Why NexPoint Residential Trust Inc. (NXRT) Looks Ripe for a TurnaroundNexPoint Residential Trust Inc. (NXRT) has become technically an oversold stock now, which implies exhaustion of the heavy selling pressure on it. This, combined with strong agreement among Wall Street analysts in revising earnings estimates higher, indicates a potential trend reversal for the stock in the near term. |
NXRT Price Returns
| 1-mo | 13.94% |
| 3-mo | 31.80% |
| 6-mo | 37.61% |
| 1-year | 11.79% |
| 3-year | -20.05% |
| 5-year | 20.73% |
| YTD | 29.29% |
| 2023 | -17.29% |
| 2022 | -46.68% |
| 2021 | 102.95% |
| 2020 | -2.70% |
| 2019 | 31.96% |
NXRT Dividends
| Ex-Dividend Date | Type | Payout Amount | Change | ||||||
|---|---|---|---|---|---|---|---|---|---|
| Loading, please wait... | |||||||||
Continue Researching NXRT
Here are a few links from around the web to help you further your research on NexPoint Residential Trust Inc's stock as an investment opportunity:NexPoint Residential Trust Inc (NXRT) Stock Price | Nasdaq
NexPoint Residential Trust Inc (NXRT) Stock Quote, History and News - Yahoo Finance
NexPoint Residential Trust Inc (NXRT) Stock Price and Basic Information | MarketWatch
Loading social stream, please wait...